|
Download Data (XLS File) |
|
||||||||
|
||||||||
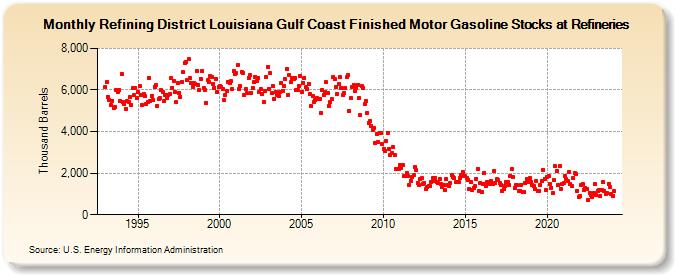
| Refining District Louisiana Gulf Coast Finished Motor Gasoline Stocks at Refineries (Thousand Barrels) | ||||||||
| Year | Jan | Feb | Mar | Apr | May | Jun | Jul | Aug | Sep | Oct | Nov | Dec |
|---|---|---|---|---|---|---|---|---|---|---|---|---|
| 1993 | 6,153 | 6,397 | 5,683 | 5,514 | 5,273 | 5,486 | 5,114 | 5,193 | 5,989 | 5,910 | 6,017 | 5,483 |
| 1994 | 6,787 | 5,404 | 5,321 | 5,100 | 5,452 | 5,433 | 5,660 | 5,280 | 6,073 | 5,736 | 6,107 | 5,606 |
| 1995 | 5,910 | 6,179 | 5,772 | 5,267 | 5,825 | 5,687 | 5,338 | 5,444 | 6,590 | 5,489 | 5,723 | 5,518 |
| 1996 | 6,160 | 6,234 | 5,247 | 5,550 | 5,598 | 5,994 | 5,912 | 5,477 | 5,777 | 5,606 | 5,773 | 5,788 |
| 1997 | 6,560 | 6,115 | 6,436 | 5,921 | 5,408 | 6,351 | 5,872 | 5,667 | 6,401 | 6,853 | 7,317 | 7,366 |
| 1998 | 6,464 | 7,466 | 6,560 | 6,332 | 6,161 | 6,319 | 6,302 | 6,933 | 6,246 | 5,977 | 6,546 | 6,920 |
| 1999 | 6,105 | 6,002 | 5,396 | 6,461 | 6,371 | 6,661 | 6,641 | 6,284 | 6,116 | 6,546 | 5,886 | 6,128 |
| 2000 | 6,197 | 6,141 | 6,044 | 5,506 | 5,770 | 5,942 | 6,405 | 6,356 | 6,408 | 6,057 | 6,917 | 6,752 |
| 2001 | 6,804 | 7,189 | 6,051 | 6,185 | 6,877 | 6,820 | 5,774 | 6,044 | 5,836 | 6,588 | 6,716 | 5,865 |
| 2002 | 6,111 | 6,360 | 6,646 | 6,424 | 6,573 | 5,894 | 6,060 | 5,814 | 5,420 | 5,971 | 6,647 | 7,118 |
| 2003 | 6,037 | 6,793 | 5,842 | 6,172 | 5,582 | 5,917 | 5,735 | 5,704 | 5,909 | 6,354 | 5,973 | 6,196 |
| 2004 | 6,506 | 6,999 | 5,764 | 6,703 | 6,368 | 6,587 | 6,506 | 6,593 | 5,996 | 5,999 | 6,171 | 6,675 |
| 2005 | 5,914 | 6,335 | 6,599 | 6,119 | 6,047 | 6,306 | 5,787 | 5,210 | 5,686 | 5,434 | 5,517 | 5,609 |
| 2006 | 5,559 | 5,584 | 4,894 | 6,020 | 5,775 | 5,923 | 6,362 | 5,857 | 5,252 | 5,405 | 5,560 | 6,624 |
| 2007 | 6,550 | 6,144 | 5,828 | 6,278 | 6,608 | 6,086 | 5,757 | 5,875 | 6,102 | 6,600 | 6,708 | 5,011 |
| 2008 | 5,611 | 6,143 | 6,244 | 5,963 | 6,107 | 6,247 | 5,636 | 4,785 | 6,173 | 6,105 | 5,304 | 5,474 |
| 2009 | 4,906 | 4,420 | 4,518 | 4,281 | 4,084 | 4,183 | 3,429 | 3,888 | 3,516 | 3,941 | 3,919 | 3,408 |
| 2010 | 3,182 | 3,069 | 3,545 | 3,932 | 3,166 | 2,881 | 2,959 | 3,235 | 2,850 | 2,188 | 2,183 | 2,184 |
| 2011 | 2,386 | 2,224 | 2,382 | 1,847 | 1,861 | 2,009 | 1,873 | 1,409 | 1,639 | 1,800 | 1,898 | 2,314 |
| 2012 | 2,137 | 1,538 | 1,410 | 1,714 | 1,743 | 1,492 | 1,543 | 1,223 | 1,343 | 1,394 | 1,359 | 1,558 |
| 2013 | 1,755 | 1,610 | 1,768 | 1,592 | 1,510 | 1,697 | 1,493 | 1,313 | 1,411 | 1,166 | 1,715 | 1,445 |
| 2014 | 1,362 | 1,502 | 1,896 | 1,834 | 1,742 | 1,561 | 1,561 | 1,571 | 1,751 | 1,902 | 2,067 | 1,879 |
| 2015 | 1,873 | 1,758 | 1,689 | 1,256 | 1,564 | 1,193 | 1,298 | 1,368 | 1,741 | 2,211 | 1,154 | 1,523 |
| 2016 | 1,116 | 1,496 | 2,030 | 1,393 | 1,589 | 1,542 | 1,487 | 1,611 | 1,498 | 2,094 | 1,507 | 1,700 |
| 2017 | 1,646 | 1,540 | 1,442 | 1,143 | 1,231 | 1,368 | 1,567 | 1,550 | 1,413 | 1,866 | 2,222 | 1,803 |
| 2018 | 1,304 | 1,427 | 1,407 | 1,131 | 1,150 | 1,445 | 1,091 | 1,085 | 1,505 | 1,719 | 1,593 | 1,762 |
| 2019 | 1,582 | 1,445 | 1,394 | 1,225 | 1,619 | 1,143 | 1,163 | 1,441 | 1,613 | 2,157 | 1,718 | 1,180 |
| 2020 | 1,802 | 1,854 | 1,482 | 1,303 | 1,066 | 1,677 | 2,322 | 2,084 | 1,432 | 2,333 | 1,239 | 1,488 |
| 2021 | 1,524 | 1,885 | 1,694 | 1,601 | 2,041 | 1,458 | 1,392 | 1,780 | 2,004 | 1,957 | 1,149 | 838 |
| 2022 | 880 | 1,448 | 1,468 | 1,194 | 1,305 | 1,236 | 721 | 1,057 | 939 | 858 | 1,056 | 1,458 |
| 2023 | 929 | 1,154 | 1,189 | 896 | 1,208 | 1,554 | 1,126 | 974 | 1,021 | 1,483 | 1,346 | 1,010 |
| 2024 | 923 | |||||||||||
| - = No Data Reported; -- = Not Applicable; NA = Not Available; W = Withheld to avoid disclosure of individual company data. |
| Release Date: 3/29/2024 |
| Next Release Date: 4/30/2024 |