|
Download Data (XLS File) |
|
||||||||
|
||||||||
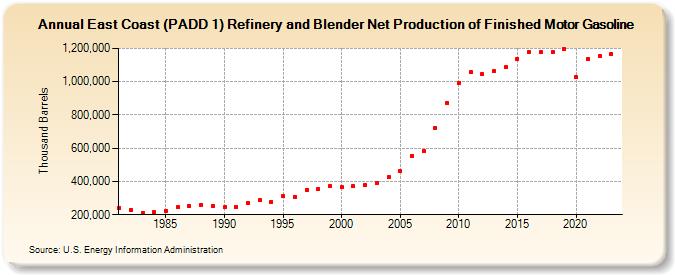
| East Coast (PADD 1) Refinery and Blender Net Production of Finished Motor Gasoline (Thousand Barrels) | ||||||||
| Decade | Year-0 | Year-1 | Year-2 | Year-3 | Year-4 | Year-5 | Year-6 | Year-7 | Year-8 | Year-9 |
|---|---|---|---|---|---|---|---|---|---|---|
| 1980's | 243,123 | 227,414 | 212,552 | 214,824 | 224,891 | 245,717 | 251,388 | 258,537 | 252,834 | |
| 1990's | 243,748 | 248,040 | 267,548 | 285,612 | 277,633 | 310,554 | 308,717 | 350,130 | 354,392 | 371,408 |
| 2000's | 364,300 | 369,750 | 377,014 | 388,787 | 424,772 | 460,911 | 555,698 | 580,182 | 723,212 | 872,233 |
| 2010's | 993,681 | 1,055,660 | 1,044,853 | 1,062,487 | 1,087,368 | 1,135,268 | 1,180,989 | 1,177,707 | 1,179,132 | 1,195,516 |
| 2020's | 1,027,330 | 1,137,453 | 1,153,142 | 1,165,098 |
| - = No Data Reported; -- = Not Applicable; NA = Not Available; W = Withheld to avoid disclosure of individual company data. |
| Release Date: 3/29/2024 |
| Next Release Date: 8/30/2024 |