|
Download Data (XLS File) |
|
||||||||
|
||||||||
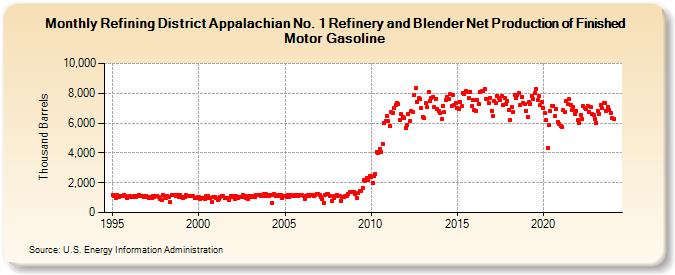
| Refining District Appalachian No. 1 Refinery and Blender Net Production of Finished Motor Gasoline (Thousand Barrels) | ||||||||
| Year | Jan | Feb | Mar | Apr | May | Jun | Jul | Aug | Sep | Oct | Nov | Dec |
|---|---|---|---|---|---|---|---|---|---|---|---|---|
| 1995 | 1,179 | 1,082 | 974 | 1,170 | 1,061 | 1,128 | 1,109 | 1,101 | 1,167 | 1,101 | 978 | 1,077 |
| 1996 | 1,083 | 1,058 | 1,040 | 1,124 | 1,064 | 1,122 | 1,176 | 1,119 | 1,093 | 1,124 | 1,044 | 1,119 |
| 1997 | 1,047 | 972 | 1,063 | 992 | 1,112 | 1,050 | 1,082 | 1,085 | 1,032 | 907 | 851 | 1,154 |
| 1998 | 1,095 | 980 | 1,133 | 1,022 | 723 | 1,192 | 1,152 | 1,184 | 1,128 | 1,175 | 1,035 | 1,158 |
| 1999 | 1,066 | 976 | 1,021 | 1,146 | 1,120 | 1,078 | 1,106 | 1,079 | 1,114 | 960 | 965 | 1,054 |
| 2000 | 1,039 | 943 | 1,001 | 987 | 900 | 1,081 | 1,087 | 986 | 972 | 676 | 1,053 | 1,031 |
| 2001 | 990 | 867 | 924 | 1,067 | 1,090 | 1,090 | 953 | 966 | 972 | 840 | 1,103 | 1,055 |
| 2002 | 1,126 | 923 | 1,118 | 1,009 | 1,012 | 1,025 | 1,033 | 1,167 | 1,093 | 951 | 932 | 1,132 |
| 2003 | 1,128 | 1,024 | 1,133 | 1,047 | 1,169 | 1,179 | 1,162 | 1,108 | 1,153 | 1,234 | 1,087 | 1,218 |
| 2004 | 1,192 | 1,115 | 1,199 | 671 | 1,246 | 1,203 | 1,138 | 1,101 | 1,149 | 1,163 | 977 | 1,132 |
| 2005 | 1,106 | 1,032 | 1,170 | 1,041 | 1,197 | 1,124 | 1,137 | 1,168 | 1,171 | 1,137 | 1,200 | 1,174 |
| 2006 | 1,168 | 1,098 | 935 | 1,124 | 1,192 | 1,100 | 1,191 | 1,184 | 1,129 | 1,189 | 1,260 | 1,238 |
| 2007 | 1,196 | 1,036 | 898 | 673 | 1,211 | 1,222 | 1,215 | 1,110 | 1,080 | 782 | 987 | 1,132 |
| 2008 | 1,199 | 1,127 | 1,092 | 760 | 1,043 | 1,014 | 1,086 | 1,080 | 1,238 | 1,392 | 1,355 | 1,371 |
| 2009 | 1,389 | 1,226 | 1,004 | 1,304 | 1,430 | 1,432 | 1,671 | 2,173 | 2,127 | 2,350 | 2,198 | 2,429 |
| 2010 | 2,407 | 2,009 | 2,484 | 2,603 | 4,063 | 4,015 | 4,291 | 4,056 | 4,624 | 5,976 | 6,150 | 6,493 |
| 2011 | 6,118 | 5,796 | 6,746 | 6,695 | 7,026 | 7,245 | 7,378 | 7,260 | 6,223 | 6,590 | 6,388 | 6,312 |
| 2012 | 5,674 | 5,894 | 6,582 | 6,140 | 6,804 | 6,726 | 7,917 | 8,351 | 7,439 | 7,656 | 7,609 | 7,020 |
| 2013 | 6,383 | 6,329 | 7,325 | 7,053 | 8,084 | 7,457 | 7,705 | 7,753 | 7,062 | 7,608 | 6,926 | 6,823 |
| 2014 | 6,704 | 6,257 | 7,168 | 6,715 | 7,544 | 7,785 | 7,639 | 7,926 | 7,177 | 7,907 | 7,203 | 7,340 |
| 2015 | 7,034 | 6,929 | 7,438 | 7,128 | 8,020 | 7,950 | 8,158 | 8,078 | 7,662 | 8,116 | 7,123 | 7,530 |
| 2016 | 6,865 | 6,834 | 7,525 | 7,275 | 8,117 | 8,135 | 8,143 | 8,269 | 7,631 | 7,614 | 7,365 | 7,698 |
| 2017 | 6,846 | 6,471 | 7,469 | 7,340 | 7,836 | 7,714 | 7,560 | 7,810 | 7,230 | 7,657 | 7,296 | 7,516 |
| 2018 | 6,874 | 6,200 | 7,058 | 6,767 | 7,889 | 7,680 | 7,895 | 7,999 | 7,194 | 7,773 | 7,365 | 7,253 |
| 2019 | 6,838 | 6,392 | 7,395 | 7,307 | 7,831 | 7,590 | 8,046 | 8,284 | 7,530 | 7,804 | 7,237 | 7,400 |
| 2020 | 7,003 | 6,650 | 6,183 | 4,326 | 5,864 | 6,794 | 7,166 | 7,153 | 6,446 | 6,957 | 6,094 | 5,937 |
| 2021 | 5,789 | 5,729 | 6,850 | 6,746 | 7,462 | 7,280 | 7,603 | 7,232 | 6,907 | 7,078 | 6,626 | 6,834 |
| 2022 | 6,180 | 6,022 | 6,561 | 6,307 | 7,125 | 7,038 | 6,914 | 7,171 | 6,757 | 7,080 | 6,598 | 6,566 |
| 2023 | 6,265 | 6,025 | 6,799 | 6,606 | 7,216 | 6,986 | 7,322 | 7,351 | 6,832 | 7,110 | 6,873 | 6,700 |
| 2024 | 6,317 | |||||||||||
| - = No Data Reported; -- = Not Applicable; NA = Not Available; W = Withheld to avoid disclosure of individual company data. |
| Release Date: 3/29/2024 |
| Next Release Date: 4/30/2024 |