|
Download Data (XLS File) |
|
||||||||
|
||||||||
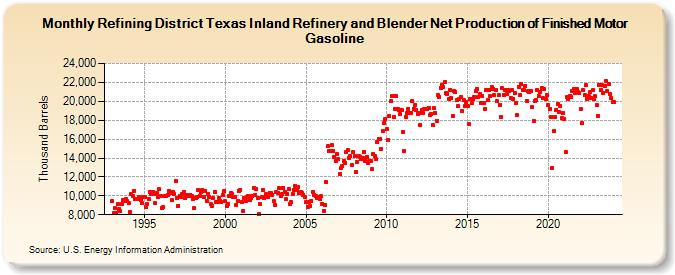
| Refining District Texas Inland Refinery and Blender Net Production of Finished Motor Gasoline (Thousand Barrels) | ||||||||
| Year | Jan | Feb | Mar | Apr | May | Jun | Jul | Aug | Sep | Oct | Nov | Dec |
|---|---|---|---|---|---|---|---|---|---|---|---|---|
| 1993 | 9,443 | 8,149 | 8,682 | 8,233 | 9,124 | 8,619 | 8,379 | 9,102 | 9,551 | 9,501 | 9,677 | 9,400 |
| 1994 | 9,207 | 8,340 | 10,171 | 9,977 | 10,554 | 9,646 | 9,636 | 9,613 | 9,869 | 9,523 | 9,191 | 9,878 |
| 1995 | 9,885 | 8,773 | 9,099 | 9,703 | 10,405 | 10,210 | 10,417 | 10,196 | 9,238 | 10,299 | 9,832 | 10,697 |
| 1996 | 9,953 | 8,753 | 8,851 | 9,929 | 9,932 | 10,106 | 10,527 | 10,338 | 9,577 | 10,443 | 10,206 | 11,580 |
| 1997 | 9,813 | 8,956 | 10,019 | 9,916 | 10,189 | 10,372 | 9,728 | 10,103 | 9,976 | 10,119 | 10,114 | 9,991 |
| 1998 | 9,678 | 8,690 | 9,815 | 9,875 | 10,601 | 9,940 | 10,416 | 10,631 | 9,865 | 10,517 | 9,450 | 10,236 |
| 1999 | 9,834 | 9,124 | 8,973 | 9,756 | 10,418 | 9,397 | 9,334 | 9,807 | 9,425 | 9,316 | 10,068 | 10,528 |
| 2000 | 9,403 | 8,926 | 9,160 | 9,968 | 10,261 | 10,213 | 9,919 | 9,924 | 9,080 | 9,415 | 10,539 | 10,646 |
| 2001 | 9,384 | 8,436 | 9,784 | 9,434 | 9,873 | 10,012 | 9,540 | 9,762 | 9,950 | 10,865 | 10,118 | 10,742 |
| 2002 | 9,773 | 8,043 | 9,088 | 9,836 | 10,589 | 9,759 | 10,167 | 9,871 | 9,830 | 10,339 | 10,293 | 10,116 |
| 2003 | 9,446 | 9,024 | 10,352 | 10,314 | 10,818 | 10,013 | 10,142 | 10,849 | 10,421 | 9,619 | 10,237 | 10,693 |
| 2004 | 9,125 | 9,297 | 10,243 | 10,569 | 11,082 | 10,592 | 10,924 | 10,281 | 10,421 | 10,321 | 10,115 | 9,879 |
| 2005 | 9,302 | 8,768 | 9,378 | 8,917 | 9,483 | 10,411 | 10,097 | 9,976 | 9,797 | 9,917 | 9,645 | 9,961 |
| 2006 | 9,143 | 8,441 | 9,074 | 11,457 | 15,229 | 14,722 | 14,703 | 15,370 | 14,732 | 14,114 | 13,679 | 14,383 |
| 2007 | 13,888 | 12,343 | 12,964 | 13,192 | 13,719 | 13,464 | 14,586 | 14,812 | 14,014 | 14,171 | 13,262 | 14,634 |
| 2008 | 14,195 | 12,553 | 13,623 | 14,182 | 14,115 | 13,847 | 14,024 | 14,683 | 13,715 | 14,114 | 13,509 | 13,642 |
| 2009 | 13,699 | 12,838 | 14,409 | 14,171 | 13,880 | 15,715 | 15,999 | 16,012 | 14,999 | 16,854 | 17,743 | 18,161 |
| 2010 | 17,059 | 15,913 | 18,437 | 19,995 | 20,558 | 18,340 | 19,162 | 20,539 | 19,187 | 19,119 | 18,667 | 19,101 |
| 2011 | 16,763 | 14,765 | 18,359 | 18,738 | 19,209 | 18,782 | 18,716 | 20,067 | 19,233 | 19,606 | 19,123 | 18,707 |
| 2012 | 18,745 | 17,534 | 19,081 | 18,795 | 19,151 | 19,179 | 19,135 | 19,297 | 18,508 | 18,656 | 17,514 | 19,275 |
| 2013 | 18,753 | 17,950 | 20,651 | 20,434 | 21,450 | 21,748 | 21,512 | 21,990 | 20,905 | 20,780 | 20,200 | 21,225 |
| 2014 | 20,333 | 18,473 | 21,075 | 20,994 | 20,096 | 19,465 | 20,237 | 20,432 | 18,958 | 20,140 | 19,482 | 19,907 |
| 2015 | 19,493 | 17,558 | 20,236 | 19,792 | 20,256 | 20,493 | 21,039 | 21,335 | 20,436 | 20,754 | 19,834 | 20,537 |
| 2016 | 19,772 | 19,220 | 21,192 | 20,098 | 21,173 | 20,532 | 21,529 | 21,281 | 20,653 | 21,223 | 20,021 | 20,676 |
| 2017 | 19,645 | 18,357 | 21,359 | 20,697 | 21,176 | 20,821 | 21,242 | 21,061 | 20,339 | 21,152 | 20,247 | 20,837 |
| 2018 | 19,833 | 18,542 | 21,563 | 20,620 | 21,808 | 21,180 | 21,218 | 21,660 | 20,077 | 21,052 | 20,958 | 21,125 |
| 2019 | 19,372 | 17,935 | 20,075 | 20,132 | 21,182 | 20,567 | 20,963 | 21,419 | 20,313 | 21,250 | 20,190 | 20,679 |
| 2020 | 19,637 | 19,186 | 18,370 | 12,971 | 16,848 | 18,348 | 19,050 | 19,717 | 18,881 | 19,515 | 18,194 | 18,758 |
| 2021 | 18,140 | 14,627 | 20,416 | 20,216 | 20,585 | 20,496 | 21,134 | 21,343 | 20,895 | 21,320 | 21,018 | 20,865 |
| 2022 | 19,203 | 17,676 | 21,154 | 20,617 | 21,704 | 20,256 | 20,604 | 20,939 | 20,357 | 21,167 | 20,208 | 20,530 |
| 2023 | 19,630 | 18,451 | 21,732 | 21,226 | 21,714 | 20,893 | 21,603 | 22,118 | 21,130 | 21,826 | 20,723 | 20,354 |
| 2024 | 19,878 | |||||||||||
| - = No Data Reported; -- = Not Applicable; NA = Not Available; W = Withheld to avoid disclosure of individual company data. |
| Release Date: 3/29/2024 |
| Next Release Date: 4/30/2024 |