|
Download Data (XLS File) |
|
||||||||
|
||||||||
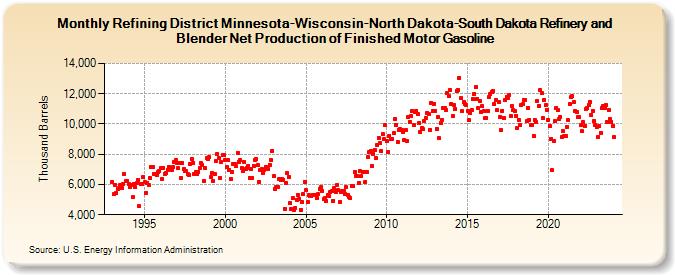
| Refining District Minnesota-Wisconsin-North Dakota-South Dakota Refinery and Blender Net Production of Finished Motor Gasoline (Thousand Barrels) | ||||||||
| Year | Jan | Feb | Mar | Apr | May | Jun | Jul | Aug | Sep | Oct | Nov | Dec |
|---|---|---|---|---|---|---|---|---|---|---|---|---|
| 1993 | 6,149 | 5,348 | 5,950 | 5,427 | 5,726 | 5,734 | 5,953 | 5,798 | 6,061 | 6,682 | 6,219 | 6,221 |
| 1994 | 6,042 | 5,862 | 5,972 | 5,141 | 6,045 | 5,821 | 6,083 | 6,319 | 4,555 | 6,045 | 6,017 | 6,477 |
| 1995 | 6,142 | 5,457 | 6,124 | 5,973 | 6,441 | 7,188 | 7,172 | 6,704 | 6,699 | 6,602 | 6,797 | 6,907 |
| 1996 | 7,086 | 6,390 | 7,091 | 6,712 | 6,758 | 6,984 | 7,176 | 7,056 | 6,986 | 7,171 | 7,504 | 7,608 |
| 1997 | 7,441 | 7,074 | 7,431 | 6,428 | 7,421 | 7,029 | 6,872 | 6,861 | 6,666 | 6,626 | 7,370 | 7,669 |
| 1998 | 7,432 | 6,697 | 6,816 | 6,674 | 6,854 | 7,062 | 7,392 | 7,277 | 6,231 | 7,065 | 7,726 | 7,667 |
| 1999 | 7,787 | 6,478 | 6,776 | 6,252 | 6,725 | 7,584 | 8,025 | 7,763 | 6,444 | 7,466 | 7,957 | 7,926 |
| 2000 | 7,608 | 7,127 | 7,605 | 6,977 | 6,378 | 6,852 | 7,353 | 7,371 | 7,204 | 8,106 | 7,505 | 7,625 |
| 2001 | 7,080 | 6,882 | 7,499 | 7,049 | 7,077 | 7,245 | 6,449 | 7,019 | 6,452 | 7,254 | 7,627 | 7,681 |
| 2002 | 7,273 | 6,167 | 6,928 | 7,004 | 6,778 | 6,983 | 7,186 | 7,061 | 7,028 | 7,307 | 7,587 | 8,246 |
| 2003 | 6,542 | 5,729 | 5,830 | 5,817 | 6,342 | 6,280 | 6,331 | 6,314 | 4,400 | 6,086 | 6,738 | 6,515 |
| 2004 | 4,768 | 4,406 | 5,100 | 4,333 | 4,456 | 5,006 | 5,317 | 5,068 | 4,343 | 4,863 | 5,362 | 6,193 |
| 2005 | 5,629 | 4,810 | 5,277 | 5,253 | 5,225 | 5,271 | 5,272 | 5,309 | 5,097 | 5,340 | 5,717 | 5,815 |
| 2006 | 5,586 | 5,016 | 5,074 | 4,910 | 5,309 | 5,224 | 5,478 | 5,547 | 4,934 | 5,745 | 5,533 | 5,974 |
| 2007 | 5,629 | 4,851 | 5,513 | 5,593 | 5,568 | 5,383 | 5,806 | 5,309 | 5,163 | 5,095 | 5,891 | 5,896 |
| 2008 | 6,817 | 6,586 | 6,530 | 6,116 | 6,884 | 6,541 | 6,834 | 6,817 | 6,180 | 6,792 | 7,829 | 8,138 |
| 2009 | 8,234 | 7,241 | 8,018 | 8,281 | 7,734 | 8,577 | 9,103 | 8,758 | 8,195 | 9,305 | 8,979 | 9,903 |
| 2010 | 8,863 | 8,144 | 9,236 | 8,986 | 9,020 | 9,375 | 10,317 | 9,943 | 8,806 | 9,606 | 9,660 | 9,621 |
| 2011 | 9,469 | 8,947 | 9,574 | 8,845 | 10,430 | 10,163 | 10,538 | 10,856 | 9,910 | 10,767 | 10,875 | 10,645 |
| 2012 | 10,096 | 9,501 | 9,710 | 9,636 | 10,203 | 10,402 | 10,745 | 10,656 | 9,625 | 11,407 | 10,872 | 11,349 |
| 2013 | 10,860 | 9,694 | 10,476 | 9,041 | 10,097 | 10,281 | 11,027 | 11,065 | 10,928 | 12,046 | 11,838 | 12,247 |
| 2014 | 11,353 | 10,540 | 11,227 | 10,992 | 12,186 | 12,271 | 13,044 | 11,698 | 10,841 | 11,458 | 11,345 | 11,278 |
| 2015 | 10,874 | 10,236 | 10,722 | 10,928 | 11,656 | 12,009 | 12,448 | 11,671 | 11,038 | 11,517 | 10,804 | 11,157 |
| 2016 | 10,874 | 10,372 | 10,406 | 10,887 | 11,770 | 11,979 | 12,115 | 12,171 | 11,305 | 11,577 | 10,920 | 11,478 |
| 2017 | 10,473 | 9,582 | 10,886 | 10,397 | 11,585 | 11,785 | 11,744 | 11,924 | 10,550 | 11,192 | 10,908 | 10,874 |
| 2018 | 10,532 | 9,726 | 10,276 | 9,911 | 11,277 | 11,320 | 11,587 | 11,598 | 10,166 | 11,080 | 10,283 | 9,929 |
| 2019 | 9,958 | 9,222 | 10,287 | 10,121 | 11,509 | 11,216 | 12,233 | 12,022 | 10,390 | 11,569 | 11,234 | 10,957 |
| 2020 | 10,270 | 9,872 | 9,033 | 6,930 | 8,895 | 10,179 | 11,083 | 10,894 | 10,315 | 10,446 | 9,138 | 9,507 |
| 2021 | 9,235 | 9,191 | 9,833 | 10,240 | 11,336 | 11,794 | 11,844 | 11,462 | 10,851 | 10,817 | 10,454 | 10,442 |
| 2022 | 9,908 | 9,508 | 10,106 | 9,849 | 10,995 | 11,025 | 11,267 | 11,483 | 10,605 | 10,890 | 10,197 | 9,938 |
| 2023 | 9,803 | 9,156 | 9,865 | 9,410 | 11,047 | 11,203 | 11,030 | 11,255 | 10,104 | 10,924 | 10,315 | 10,149 |
| 2024 | 9,837 | |||||||||||
| - = No Data Reported; -- = Not Applicable; NA = Not Available; W = Withheld to avoid disclosure of individual company data. |
| Release Date: 3/29/2024 |
| Next Release Date: 4/30/2024 |