|
Download Data (XLS File) |
|
||||||||
|
||||||||
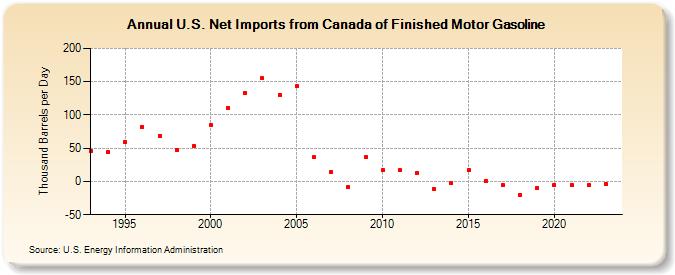
| U.S. Net Imports from Canada of Finished Motor Gasoline (Thousand Barrels per Day) | ||||||||
| Decade | Year-0 | Year-1 | Year-2 | Year-3 | Year-4 | Year-5 | Year-6 | Year-7 | Year-8 | Year-9 |
|---|---|---|---|---|---|---|---|---|---|---|
| 1990's | 46 | 44 | 59 | 82 | 69 | 48 | 53 | |||
| 2000's | 85 | 111 | 133 | 155 | 130 | 143 | 36 | 14 | -8 | 36 |
| 2010's | 17 | 17 | 12 | -11 | -3 | 17 | 1 | -6 | -20 | -10 |
| 2020's | -5 | -5 | -6 | -5 |
| - = No Data Reported; -- = Not Applicable; NA = Not Available; W = Withheld to avoid disclosure of individual company data. |
| Release Date: 8/30/2024 |
| Next Release Date: 8/29/2025 |