|
Download Data (XLS File) |
|
||||||||
|
||||||||
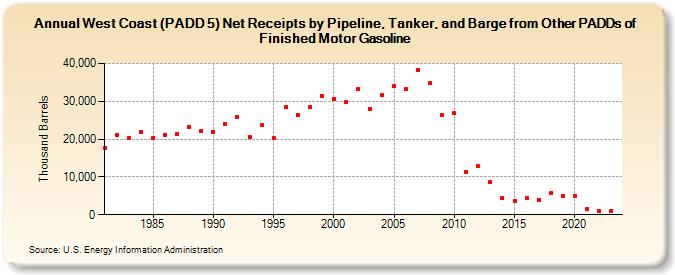
| West Coast (PADD 5) Net Receipts by Pipeline, Tanker, and Barge from Other PADDs of Finished Motor Gasoline (Thousand Barrels) | ||||||||
| Decade | Year-0 | Year-1 | Year-2 | Year-3 | Year-4 | Year-5 | Year-6 | Year-7 | Year-8 | Year-9 |
|---|---|---|---|---|---|---|---|---|---|---|
| 1980's | 17,664 | 20,970 | 20,402 | 21,971 | 20,278 | 21,002 | 21,458 | 23,229 | 22,193 | |
| 1990's | 21,861 | 24,002 | 25,815 | 20,619 | 23,639 | 20,238 | 28,364 | 26,501 | 28,598 | 31,424 |
| 2000's | 30,584 | 29,705 | 33,183 | 28,034 | 31,537 | 34,016 | 33,342 | 38,344 | 34,740 | 26,399 |
| 2010's | 26,820 | 11,376 | 12,795 | 8,770 | 4,416 | 3,642 | 4,449 | 3,914 | 5,671 | 5,070 |
| 2020's | 5,031 | 1,642 | 1,071 | 1,074 |
| - = No Data Reported; -- = Not Applicable; NA = Not Available; W = Withheld to avoid disclosure of individual company data. |
| Release Date: 3/29/2024 |
| Next Release Date: 8/30/2024 |