|
Download Data (XLS File) |
|
||||||||
|
||||||||
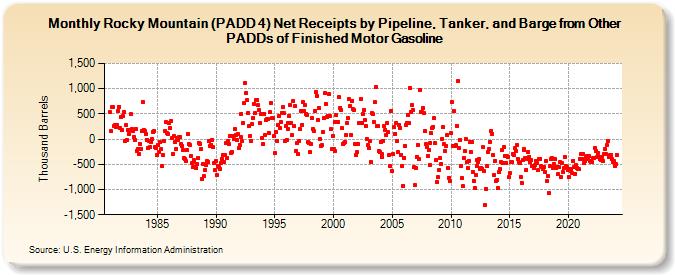
| Rocky Mountain (PADD 4) Net Receipts by Pipeline, Tanker, and Barge from Other PADDs of Finished Motor Gasoline (Thousand Barrels) | ||||||||
| Year | Jan | Feb | Mar | Apr | May | Jun | Jul | Aug | Sep | Oct | Nov | Dec |
|---|---|---|---|---|---|---|---|---|---|---|---|---|
| 1981 | 531 | 155 | 634 | 627 | 265 | 275 | 244 | 271 | 563 | 643 | 216 | 444 |
| 1982 | 173 | 456 | 533 | -39 | 273 | -16 | 178 | 107 | 176 | 489 | 205 | 168 |
| 1983 | 49 | -13 | 207 | -229 | -202 | -291 | -94 | -195 | 168 | 735 | 190 | 157 |
| 1984 | 100 | -13 | -21 | -183 | -31 | -160 | -63 | 2 | 145 | 159 | -150 | -176 |
| 1985 | -317 | -112 | -253 | -66 | -203 | -536 | -316 | -34 | 165 | 333 | 113 | 103 |
| 1986 | 317 | 226 | 351 | 18 | -291 | 57 | -60 | -201 | 15 | -10 | 37 | 48 |
| 1987 | -90 | -128 | -215 | -375 | -394 | -430 | -222 | 104 | -97 | -113 | -335 | -484 |
| 1988 | -560 | -423 | -453 | -546 | -570 | -500 | -377 | -76 | -89 | -190 | -782 | -495 |
| 1989 | -739 | -612 | -519 | -432 | -447 | -28 | -133 | -117 | -15 | -166 | -472 | -621 |
| 1990 | -434 | -714 | -525 | -550 | -584 | -473 | -389 | -320 | -446 | -322 | -86 | -367 |
| 1991 | -46 | -93 | 58 | -279 | -250 | 53 | -2 | 193 | 81 | -13 | 99 | -183 |
| 1992 | -117 | 44 | 502 | -47 | 323 | 712 | 1,120 | 919 | 772 | 526 | 264 | 68 |
| 1993 | -29 | 299 | 428 | 705 | 518 | 774 | 779 | 673 | 575 | 329 | 488 | 12 |
| 1994 | -102 | 504 | 80 | 373 | 395 | 404 | 130 | 529 | 722 | 417 | 415 | 55 |
| 1995 | -281 | 140 | -30 | 284 | 461 | 215 | 336 | 522 | 627 | 524 | -37 | 259 |
| 1996 | -14 | 196 | 315 | 455 | 673 | 312 | 72 | 752 | 252 | 653 | -230 | -72 |
| 1997 | -298 | -36 | 194 | 551 | 285 | 726 | 557 | 680 | 500 | 481 | -53 | -86 |
| 1998 | -256 | -101 | 414 | 202 | 155 | 563 | 932 | 850 | 380 | 612 | 9 | -128 |
| 1999 | -125 | 139 | 418 | 908 | 706 | 441 | 466 | 895 | 451 | 193 | -199 | 65 |
| 2000 | -195 | -232 | 337 | 473 | 339 | 339 | 829 | 620 | 581 | 214 | -99 | -86 |
| 2001 | -66 | 83 | 325 | 414 | 795 | 656 | 88 | 763 | 592 | 575 | -99 | -321 |
| 2002 | -256 | -99 | 312 | 312 | 803 | 319 | 490 | 580 | 376 | 252 | 8 | -120 |
| 2003 | -170 | -37 | -458 | 522 | 489 | 340 | 727 | 1,024 | 254 | 260 | -243 | -255 |
| 2004 | -52 | -291 | -353 | -41 | 261 | 178 | 86 | 326 | 133 | -310 | -542 | 549 |
| 2005 | -633 | -304 | 231 | 111 | 322 | -29 | -259 | 282 | 223 | -307 | -528 | -928 |
| 2006 | -377 | -139 | 278 | 328 | 473 | 310 | 1,018 | 541 | 675 | 578 | -563 | -919 |
| 2007 | -581 | -346 | -110 | -399 | 979 | 547 | 545 | 611 | 514 | 154 | -106 | -159 |
| 2008 | -342 | -217 | -518 | -69 | 112 | 220 | 245 | 412 | -87 | -410 | -859 | -758 |
| 2009 | -613 | -379 | -501 | 10 | 234 | -102 | -227 | -130 | 74 | -575 | -765 | -829 |
| 2010 | 114 | 731 | -146 | 552 | -138 | -121 | 269 | 1,145 | -184 | -11 | -541 | -771 |
| 2011 | -938 | -366 | -244 | 6 | -461 | -567 | -431 | -51 | -249 | -50 | -645 | -822 |
| 2012 | -967 | -716 | -535 | -418 | -445 | -396 | -603 | -574 | -588 | -163 | -642 | -1,317 |
| 2013 | -989 | -537 | -258 | -187 | -51 | 152 | 111 | -315 | -716 | -427 | -825 | -815 |
| 2014 | -972 | -654 | -602 | -450 | -223 | -480 | -155 | -331 | -473 | -331 | -350 | -757 |
| 2015 | -678 | -462 | -457 | -299 | -310 | -180 | -240 | -115 | -391 | -459 | -476 | -743 |
| 2016 | -863 | -419 | -199 | -222 | -374 | -605 | -386 | -250 | -354 | -446 | -415 | -533 |
| 2017 | -539 | -576 | -515 | -425 | -474 | -620 | -391 | -387 | -536 | -558 | -588 | -555 |
| 2018 | -654 | -435 | -832 | -730 | -1,074 | -542 | -399 | -376 | -581 | -490 | -404 | -582 |
| 2019 | -563 | -698 | -551 | -463 | -754 | -484 | -656 | -582 | -351 | -534 | -544 | -611 |
| 2020 | -749 | -590 | -595 | -641 | -678 | -429 | -547 | -684 | -522 | -570 | -597 | -603 |
| 2021 | -398 | -293 | -388 | -295 | -471 | -430 | -351 | -340 | -401 | -343 | -425 | -461 |
| 2022 | -464 | -382 | -369 | -176 | -231 | -360 | -275 | -361 | -391 | -410 | -360 | -438 |
| 2023 | -299 | -194 | -302 | -125 | -33 | -355 | -324 | -308 | -403 | -461 | -444 | -525 |
| 2024 | -494 | |||||||||||
| - = No Data Reported; -- = Not Applicable; NA = Not Available; W = Withheld to avoid disclosure of individual company data. |
| Release Date: 3/29/2024 |
| Next Release Date: 4/30/2024 |