|
Download Data (XLS File) |
|
||||||||
|
||||||||
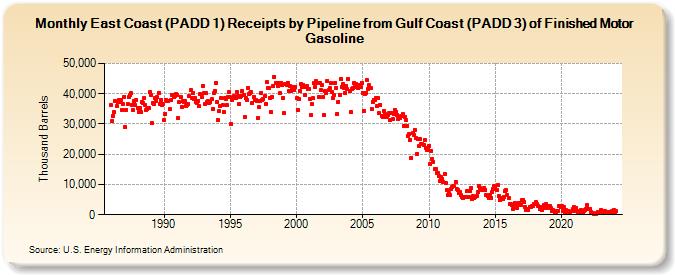
| East Coast (PADD 1) Receipts by Pipeline from Gulf Coast (PADD 3) of Finished Motor Gasoline (Thousand Barrels) | ||||||||
| Year | Jan | Feb | Mar | Apr | May | Jun | Jul | Aug | Sep | Oct | Nov | Dec |
|---|---|---|---|---|---|---|---|---|---|---|---|---|
| 1986 | 36,191 | 31,039 | 32,768 | 33,838 | 37,470 | 35,883 | 37,226 | 37,886 | 37,262 | 37,912 | 34,735 | 36,548 |
| 1987 | 39,010 | 29,009 | 34,765 | 36,514 | 38,890 | 39,561 | 40,103 | 36,437 | 34,735 | 37,633 | 36,220 | 37,976 |
| 1988 | 35,317 | 34,066 | 35,174 | 33,972 | 37,380 | 36,945 | 38,552 | 36,271 | 34,737 | 34,909 | 35,211 | 40,475 |
| 1989 | 39,738 | 30,295 | 37,014 | 36,445 | 38,551 | 37,751 | 38,754 | 40,311 | 36,607 | 38,028 | 36,331 | 36,601 |
| 1990 | 31,448 | 33,448 | 37,930 | 37,449 | 37,756 | 34,813 | 37,772 | 39,612 | 39,719 | 38,947 | 39,403 | 39,942 |
| 1991 | 39,633 | 31,936 | 37,126 | 39,052 | 35,714 | 37,454 | 37,359 | 37,450 | 35,874 | 36,196 | 36,705 | 39,155 |
| 1992 | 41,134 | 38,711 | 40,108 | 38,311 | 38,635 | 37,189 | 37,029 | 37,689 | 35,806 | 39,795 | 38,820 | 42,585 |
| 1993 | 40,091 | 36,647 | 40,147 | 37,121 | 37,486 | 37,077 | 37,414 | 38,126 | 35,101 | 40,158 | 41,017 | 43,539 |
| 1994 | 37,191 | 31,160 | 34,226 | 35,873 | 38,603 | 36,179 | 33,893 | 38,518 | 38,227 | 36,207 | 38,980 | 40,514 |
| 1995 | 38,780 | 29,966 | 37,949 | 39,157 | 39,031 | 38,447 | 40,671 | 39,335 | 36,546 | 38,877 | 39,361 | 40,982 |
| 1996 | 39,596 | 32,341 | 38,487 | 38,033 | 41,856 | 39,791 | 40,356 | 40,499 | 37,085 | 39,065 | 37,881 | 37,892 |
| 1997 | 37,543 | 32,016 | 35,520 | 37,707 | 40,196 | 38,000 | 38,362 | 39,089 | 36,745 | 43,856 | 41,865 | 41,882 |
| 1998 | 38,620 | 34,024 | 39,022 | 42,502 | 45,693 | 43,479 | 43,643 | 42,644 | 43,490 | 40,138 | 43,688 | 42,843 |
| 1999 | 38,530 | 33,537 | 43,089 | 42,748 | 43,630 | 40,884 | 42,572 | 41,050 | 41,921 | 42,380 | 41,296 | 42,240 |
| 2000 | 38,477 | 34,567 | 38,413 | 40,946 | 43,188 | 42,156 | 42,936 | 42,064 | 39,421 | 42,451 | 41,608 | 41,712 |
| 2001 | 38,394 | 33,020 | 36,684 | 38,503 | 43,639 | 42,360 | 44,143 | 43,627 | 38,960 | 43,568 | 41,133 | 42,883 |
| 2002 | 38,983 | 32,997 | 40,750 | 40,226 | 44,303 | 41,160 | 41,792 | 43,623 | 40,594 | 38,725 | 39,614 | 43,686 |
| 2003 | 41,914 | 33,458 | 37,376 | 39,665 | 44,877 | 42,333 | 43,080 | 41,904 | 40,195 | 42,697 | 41,440 | 44,814 |
| 2004 | 40,742 | 33,888 | 41,666 | 41,819 | 43,702 | 42,261 | 43,302 | 42,599 | 41,841 | 42,906 | 42,082 | 43,711 |
| 2005 | 40,329 | 34,444 | 39,899 | 40,361 | 44,420 | 41,535 | 42,758 | 42,049 | 35,009 | 37,370 | 37,996 | 38,072 |
| 2006 | 38,557 | 36,016 | 38,463 | 33,610 | 36,369 | 32,778 | 32,235 | 34,369 | 33,135 | 32,352 | 32,518 | 33,070 |
| 2007 | 33,606 | 31,367 | 33,740 | 31,521 | 33,440 | 34,620 | 33,968 | 32,850 | 31,610 | 32,376 | 32,017 | 32,649 |
| 2008 | 33,319 | 29,355 | 32,419 | 31,265 | 29,460 | 25,992 | 26,641 | 24,802 | 18,903 | 26,856 | 26,361 | 28,089 |
| 2009 | 25,317 | 20,183 | 25,154 | 22,770 | 25,049 | 23,351 | 23,454 | 23,153 | 24,753 | 22,116 | 21,552 | 21,550 |
| 2010 | 22,831 | 16,885 | 21,090 | 18,494 | 17,569 | 15,171 | 15,175 | 13,842 | 13,644 | 12,679 | 11,178 | 12,465 |
| 2011 | 11,760 | 10,846 | 13,489 | 10,509 | 8,121 | 6,632 | 7,146 | 6,560 | 8,619 | 9,157 | 9,360 | 9,345 |
| 2012 | 10,924 | 8,420 | 8,221 | 7,180 | 7,606 | 6,415 | 5,825 | 5,658 | 5,791 | 5,773 | 7,800 | 8,003 |
| 2013 | 5,786 | 7,843 | 8,977 | 5,074 | 6,080 | 5,648 | 5,954 | 6,132 | 7,563 | 9,510 | 8,680 | 8,480 |
| 2014 | 8,092 | 8,314 | 8,765 | 8,317 | 6,526 | 6,255 | 5,676 | 6,643 | 5,622 | 7,574 | 8,547 | 9,565 |
| 2015 | 8,771 | 8,064 | 9,811 | 6,123 | 4,998 | 5,474 | 5,304 | 5,032 | 5,880 | 7,852 | 8,104 | 6,369 |
| 2016 | 5,616 | 3,524 | 3,408 | 3,143 | 2,036 | 2,527 | 3,730 | 3,612 | 2,361 | 3,979 | 3,448 | 3,060 |
| 2017 | 4,715 | 4,877 | 4,215 | 2,578 | 1,529 | 1,759 | 1,481 | 2,664 | 2,428 | 2,733 | 3,024 | 3,520 |
| 2018 | 3,604 | 4,132 | 3,446 | 2,851 | 2,047 | 2,455 | 1,568 | 2,372 | 3,264 | 3,102 | 3,475 | 2,243 |
| 2019 | 2,973 | 2,979 | 2,255 | 1,106 | 1,467 | 1,142 | 762 | 834 | 1,365 | 1,347 | 2,742 | 2,407 |
| 2020 | 2,834 | 1,146 | 2,414 | 1,050 | 1,509 | 1,230 | 1,247 | 1,005 | 867 | 1,137 | 1,812 | 2,511 |
| 2021 | 1,313 | 2,239 | 1,374 | 1,008 | 582 | 1,295 | 1,453 | 809 | 1,148 | 1,710 | 1,820 | 3,248 |
| 2022 | 1,997 | 1,997 | 1,936 | 882 | 567 | 334 | 221 | 340 | 464 | 982 | 982 | 982 |
| 2023 | 1,514 | 1,095 | 997 | 1,168 | 628 | 762 | 841 | 696 | 732 | 825 | 1,139 | 1,501 |
| 2024 | 1,043 | |||||||||||
| - = No Data Reported; -- = Not Applicable; NA = Not Available; W = Withheld to avoid disclosure of individual company data. |
| Release Date: 3/29/2024 |
| Next Release Date: 4/30/2024 |