|
Download Data (XLS File) |
|
||||||||
|
||||||||
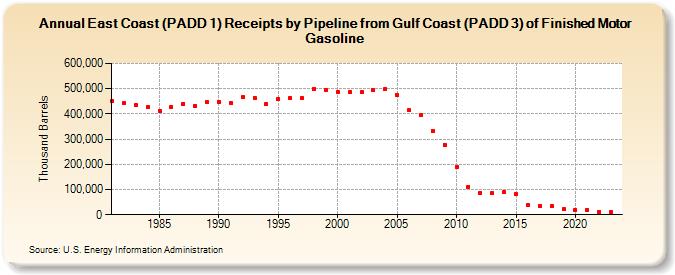
| East Coast (PADD 1) Receipts by Pipeline from Gulf Coast (PADD 3) of Finished Motor Gasoline (Thousand Barrels) | ||||||||
| Decade | Year-0 | Year-1 | Year-2 | Year-3 | Year-4 | Year-5 | Year-6 | Year-7 | Year-8 | Year-9 |
|---|---|---|---|---|---|---|---|---|---|---|
| 1980's | 450,271 | 442,070 | 433,773 | 427,618 | 412,750 | 428,758 | 440,853 | 433,009 | 446,426 | |
| 1990's | 448,239 | 443,654 | 465,812 | 463,924 | 439,571 | 459,102 | 462,882 | 462,781 | 499,786 | 493,877 |
| 2000's | 487,939 | 486,914 | 486,453 | 493,753 | 500,519 | 474,242 | 413,472 | 393,764 | 333,462 | 278,402 |
| 2010's | 191,023 | 111,544 | 87,616 | 85,727 | 89,896 | 81,782 | 40,444 | 35,523 | 34,559 | 21,379 |
| 2020's | 18,762 | 17,999 | 11,684 | 11,898 |
| - = No Data Reported; -- = Not Applicable; NA = Not Available; W = Withheld to avoid disclosure of individual company data. |
| Release Date: 8/30/2024 |
| Next Release Date: 8/29/2025 |