|
Download Data (XLS File) |
|
||||||||
|
||||||||
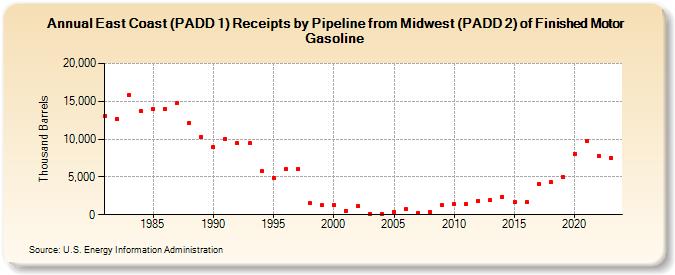
| East Coast (PADD 1) Receipts by Pipeline from Midwest (PADD 2) of Finished Motor Gasoline (Thousand Barrels) | ||||||||
| Decade | Year-0 | Year-1 | Year-2 | Year-3 | Year-4 | Year-5 | Year-6 | Year-7 | Year-8 | Year-9 |
|---|---|---|---|---|---|---|---|---|---|---|
| 1980's | 13,051 | 12,667 | 15,834 | 13,682 | 13,957 | 14,045 | 14,709 | 12,173 | 10,343 | |
| 1990's | 8,942 | 10,016 | 9,438 | 9,431 | 5,728 | 4,894 | 6,002 | 6,027 | 1,499 | 1,226 |
| 2000's | 1,268 | 556 | 1,140 | 109 | 104 | 377 | 693 | 238 | 393 | 1,225 |
| 2010's | 1,373 | 1,371 | 1,865 | 1,924 | 2,367 | 1,714 | 1,641 | 4,030 | 4,297 | 4,989 |
| 2020's | 8,086 | 9,786 | 7,765 | 7,520 |
| - = No Data Reported; -- = Not Applicable; NA = Not Available; W = Withheld to avoid disclosure of individual company data. |
| Release Date: 3/29/2024 |
| Next Release Date: 8/30/2024 |