|
Download Data (XLS File) |
|
||||||||
|
||||||||
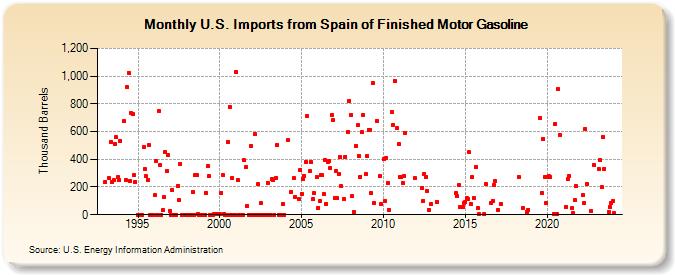
| U.S. Imports from Spain of Finished Motor Gasoline (Thousand Barrels) | ||||||||
| Year | Jan | Feb | Mar | Apr | May | Jun | Jul | Aug | Sep | Oct | Nov | Dec |
|---|---|---|---|---|---|---|---|---|---|---|---|---|
| 1993 | 237 | 263 | 523 | 236 | 249 | 509 | 558 | 269 | 248 | 534 | ||
| 1994 | 674 | 247 | 921 | 1,025 | 246 | 733 | 726 | 284 | 239 | |||
| 1995 | 0 | 0 | 0 | 0 | 489 | 328 | 276 | 250 | 501 | 0 | 0 | 0 |
| 1996 | 139 | 391 | 0 | 748 | 358 | 0 | 31 | 125 | 454 | 317 | 432 | 27 |
| 1997 | 0 | 178 | 0 | 0 | 0 | 210 | 103 | 369 | 0 | 0 | 0 | 0 |
| 1998 | 0 | 0 | 0 | 0 | 167 | 0 | 286 | 284 | 7 | 0 | 0 | 0 |
| 1999 | 0 | 0 | 158 | 351 | 279 | 0 | 0 | 0 | 5 | 5 | 6 | 6 |
| 2000 | 3 | 157 | 286 | 8 | 0 | 0 | 527 | 780 | 0 | 265 | 0 | 0 |
| 2001 | 1,030 | 250 | 0 | 0 | 0 | 0 | 392 | 343 | 64 | 0 | 0 | 495 |
| 2002 | 0 | 0 | 579 | 0 | 219 | 0 | 83 | 0 | 0 | 0 | 0 | 232 |
| 2003 | 0 | 0 | 255 | 248 | 0 | 268 | 504 | 0 | 0 | 0 | 76 | 0 |
| 2004 | 537 | 167 | 263 | 130 | 115 | 321 | ||||||
| 2005 | 152 | 259 | 279 | 381 | 710 | 313 | 379 | 110 | 155 | 271 | ||
| 2006 | 52 | 100 | 284 | 283 | 151 | 393 | 78 | 382 | 384 | 338 | 718 | 683 |
| 2007 | 120 | 316 | 117 | 297 | 417 | 204 | 114 | 420 | 600 | 821 | ||
| 2008 | 720 | 132 | 21 | 494 | 645 | 427 | 275 | 594 | 723 | 295 | ||
| 2009 | 423 | 612 | 613 | 155 | 952 | 86 | 678 | 278 | 78 | |||
| 2010 | 402 | 100 | 408 | 230 | 36 | 740 | 648 | 964 | 623 | 509 | ||
| 2011 | 275 | 275 | 232 | 276 | 592 | 263 | ||||||
| 2012 | 193 | 100 | 294 | 271 | 172 | 35 | 75 | |||||
| 2013 | 95 | |||||||||||
| 2014 | 154 | 133 | 212 | 59 | 53 | 58 | 86 | |||||
| 2015 | 92 | 118 | 111 | 449 | 78 | 269 | 120 | 345 | 48 | 4 | ||
| 2016 | 3 | 220 | 86 | 102 | 217 | 241 | ||||||
| 2017 | 35 | 79 | ||||||||||
| 2018 | 275 | 51 | 22 | 37 | ||||||||
| 2019 | 701 | 160 | 547 | 273 | 84 | |||||||
| 2020 | 270 | 276 | 274 | 6 | 657 | 3 | 906 | 578 | ||||
| 2021 | 56 | 256 | 281 | 48 | 15 | 103 | 207 | |||||
| 2022 | 140 | 83 | 617 | 225 | 26 | 360 | ||||||
| 2023 | 328 | 393 | 197 | 561 | 332 | 18 | 58 | 87 | ||||
| 2024 | 100 | |||||||||||
| - = No Data Reported; -- = Not Applicable; NA = Not Available; W = Withheld to avoid disclosure of individual company data. |
| Release Date: 3/29/2024 |
| Next Release Date: 4/30/2024 |