|
Download Data (XLS File) |
|
||||||||
|
||||||||
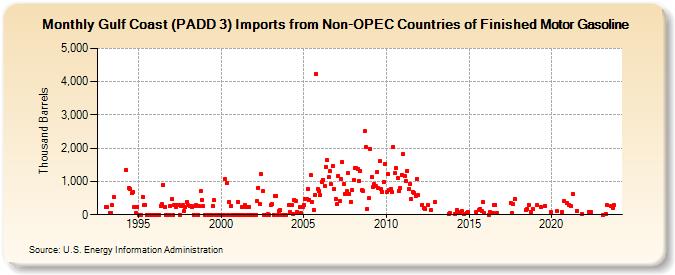
| Gulf Coast (PADD 3) Imports from Non-OPEC Countries of Finished Motor Gasoline (Thousand Barrels) | ||||||||
| Year | Jan | Feb | Mar | Apr | May | Jun | Jul | Aug | Sep | Oct | Nov | Dec |
|---|---|---|---|---|---|---|---|---|---|---|---|---|
| 1993 | 228 | 229 | 45 | 53 | 282 | 526 | ||||||
| 1994 | 1,357 | 792 | 776 | 643 | 685 | 222 | 55 | 244 | ||||
| 1995 | 0 | 0 | 0 | 546 | 290 | 285 | 0 | 0 | 0 | 0 | 0 | 0 |
| 1996 | 0 | 0 | 0 | 0 | 272 | 310 | 896 | 244 | 0 | 0 | 0 | 269 |
| 1997 | 469 | 0 | 285 | 240 | 303 | 290 | 0 | 247 | 290 | 100 | 241 | 379 |
| 1998 | 282 | 265 | 268 | 243 | 0 | 277 | 290 | 0 | 247 | 712 | 451 | 252 |
| 1999 | 0 | 0 | 0 | 0 | 0 | 0 | 267 | 432 | 0 | 0 | 0 | 0 |
| 2000 | 0 | 4 | 0 | 1,080 | 949 | 0 | 386 | 268 | 0 | 0 | 0 | 0 |
| 2001 | 391 | 0 | 0 | 232 | 0 | 280 | 227 | 0 | 239 | 0 | 0 | 0 |
| 2002 | 0 | 0 | 403 | 813 | 319 | 1,211 | 702 | 0 | 0 | 0 | 11 | 0 |
| 2003 | 284 | 309 | 0 | 558 | 549 | 0 | 117 | 149 | 0 | 0 | 0 | 0 |
| 2004 | 287 | 79 | 291 | 32 | 454 | 417 | 73 | 229 | 50 | 225 | ||
| 2005 | 294 | 472 | 468 | 759 | 453 | 1,183 | 385 | 155 | 600 | 4,235 | 760 | 710 |
| 2006 | 588 | 998 | 1,052 | 864 | 1,447 | 1,638 | 1,122 | 1,301 | 914 | 1,478 | 771 | 470 |
| 2007 | 314 | 1,177 | 405 | 1,068 | 1,592 | 929 | 627 | 702 | 1,240 | 631 | 397 | 737 |
| 2008 | 1,050 | 1,397 | 1,409 | 1,378 | 1,005 | 1,314 | 740 | 725 | 2,504 | 2,027 | 178 | 500 |
| 2009 | 1,983 | 1,128 | 839 | 925 | 858 | 1,271 | 798 | 1,614 | 758 | 692 | 992 | 1,536 |
| 2010 | 677 | 1,219 | 732 | 765 | 668 | 2,047 | 1,240 | 1,398 | 1,094 | 727 | 809 | 1,202 |
| 2011 | 1,813 | 1,164 | 1,006 | 1,328 | 778 | 916 | 470 | 680 | 658 | 568 | 1,084 | 596 |
| 2012 | 300 | 199 | 171 | 294 | 131 | 384 | ||||||
| 2013 | 34 | 41 | ||||||||||
| 2014 | 23 | 127 | 38 | 86 | 97 | 8 | 58 | 86 | ||||
| 2015 | 79 | 127 | 184 | 116 | 379 | 59 | ||||||
| 2016 | 4 | 96 | 65 | 290 | 296 | 57 | ||||||
| 2017 | 360 | 50 | 312 | 465 | ||||||||
| 2018 | 135 | 166 | 296 | 82 | 159 | |||||||
| 2019 | 284 | 228 | 273 | 84 | ||||||||
| 2020 | 100 | 89 | 405 | 338 | ||||||||
| 2021 | 306 | 256 | 629 | 123 | 36 | |||||||
| 2022 | 94 | 85 | ||||||||||
| 2023 | 5 | 32 | 283 | 260 | 197 | 283 | ||||||
| - = No Data Reported; -- = Not Applicable; NA = Not Available; W = Withheld to avoid disclosure of individual company data. |
| Release Date: 3/29/2024 |
| Next Release Date: 4/30/2024 |