|
Download Data (XLS File) |
|
||||||||
|
||||||||
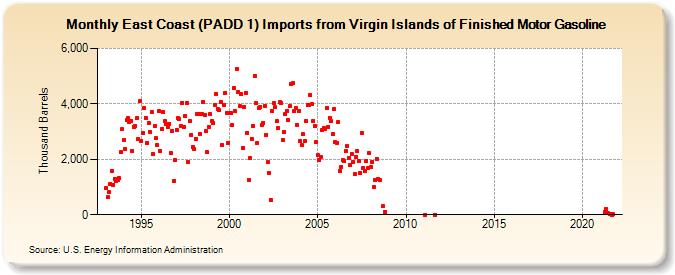
| East Coast (PADD 1) Imports from Virgin Islands of Finished Motor Gasoline (Thousand Barrels) | ||||||||
| Year | Jan | Feb | Mar | Apr | May | Jun | Jul | Aug | Sep | Oct | Nov | Dec |
|---|---|---|---|---|---|---|---|---|---|---|---|---|
| 1993 | 946 | 623 | 804 | 1,117 | 1,593 | 1,084 | 1,305 | 1,229 | 1,255 | 1,309 | 2,261 | 3,076 |
| 1994 | 2,689 | 2,370 | 3,416 | 3,496 | 3,355 | 3,393 | 2,305 | 3,162 | 3,208 | 3,483 | 2,718 | 4,085 |
| 1995 | 2,649 | 2,954 | 3,845 | 3,502 | 2,603 | 3,324 | 3,001 | 3,698 | 2,192 | 3,189 | 2,750 | 2,519 |
| 1996 | 3,741 | 2,298 | 3,104 | 3,707 | 3,369 | 3,262 | 3,156 | 3,273 | 2,231 | 3,012 | 1,214 | 1,972 |
| 1997 | 3,068 | 3,484 | 3,451 | 3,201 | 4,032 | 3,173 | 3,575 | 4,037 | 1,896 | 3,366 | 2,876 | 2,437 |
| 1998 | 2,365 | 2,745 | 3,629 | 3,639 | 2,923 | 3,634 | 4,071 | 3,610 | 3,003 | 2,252 | 3,165 | 3,624 |
| 1999 | 3,389 | 3,300 | 3,969 | 4,360 | 3,828 | 3,768 | 4,084 | 2,516 | 3,958 | 4,402 | 3,685 | 2,592 |
| 2000 | 3,670 | 3,661 | 3,244 | 4,573 | 3,729 | 5,244 | 4,425 | 3,911 | 4,358 | 2,422 | 3,879 | 4,402 |
| 2001 | 2,964 | 1,258 | 2,036 | 2,741 | 3,193 | 5,013 | 4,034 | 2,575 | 3,852 | 3,892 | 3,253 | 3,324 |
| 2002 | 3,935 | 2,890 | 1,888 | 1,511 | 542 | 3,741 | 4,015 | 3,868 | 3,370 | 3,136 | 4,054 | 4,033 |
| 2003 | 2,702 | 3,001 | 3,619 | 3,752 | 3,407 | 3,906 | 4,713 | 4,739 | 3,749 | 3,844 | 3,247 | 3,727 |
| 2004 | 2,659 | 2,498 | 2,902 | 2,647 | 3,388 | 3,960 | 3,959 | 4,314 | 3,983 | 3,376 | 3,209 | 2,621 |
| 2005 | 2,147 | 1,981 | 2,072 | 3,057 | 3,123 | 3,100 | 3,832 | 3,166 | 3,503 | 3,380 | 2,900 | 3,816 |
| 2006 | 2,611 | 2,597 | 3,344 | 1,566 | 1,735 | 1,969 | 1,926 | 2,285 | 2,467 | 2,063 | 1,802 | 2,193 |
| 2007 | 1,918 | 1,452 | 2,065 | 2,283 | 1,934 | 1,503 | 2,945 | 1,700 | 1,563 | 1,941 | 1,677 | 2,217 |
| 2008 | 1,713 | 1,911 | 1,015 | 1,266 | 2,026 | 1,290 | 1,241 | 300 | 110 | |||
| 2011 | 5 | 7 | ||||||||||
| 2021 | 80 | 220 | 78 | 32 | 6 | 9 | ||||||
| - = No Data Reported; -- = Not Applicable; NA = Not Available; W = Withheld to avoid disclosure of individual company data. |
| Release Date: 3/29/2024 |
| Next Release Date: 4/30/2024 |