|
Download Data (XLS File) |
|
||||||||
|
||||||||
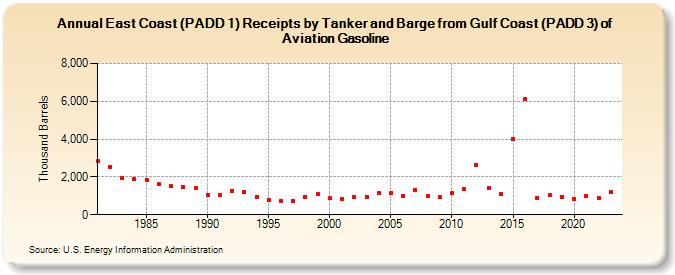
| East Coast (PADD 1) Receipts by Tanker and Barge from Gulf Coast (PADD 3) of Aviation Gasoline (Thousand Barrels) | ||||||||
| Decade | Year-0 | Year-1 | Year-2 | Year-3 | Year-4 | Year-5 | Year-6 | Year-7 | Year-8 | Year-9 |
|---|---|---|---|---|---|---|---|---|---|---|
| 1980's | 2,848 | 2,536 | 1,948 | 1,882 | 1,855 | 1,612 | 1,514 | 1,487 | 1,397 | |
| 1990's | 1,032 | 1,068 | 1,255 | 1,206 | 957 | 784 | 745 | 723 | 926 | 1,103 |
| 2000's | 887 | 806 | 937 | 963 | 1,128 | 1,161 | 996 | 1,304 | 1,006 | 943 |
| 2010's | 1,141 | 1,374 | 2,638 | 1,407 | 1,113 | 3,982 | 6,147 | 886 | 1,056 | 954 |
| 2020's | 827 | 986 | 884 | 1,180 |
| - = No Data Reported; -- = Not Applicable; NA = Not Available; W = Withheld to avoid disclosure of individual company data. |
| Release Date: 3/29/2024 |
| Next Release Date: 8/30/2024 |