|
Download Data (XLS File) |
|
||||||||
|
||||||||
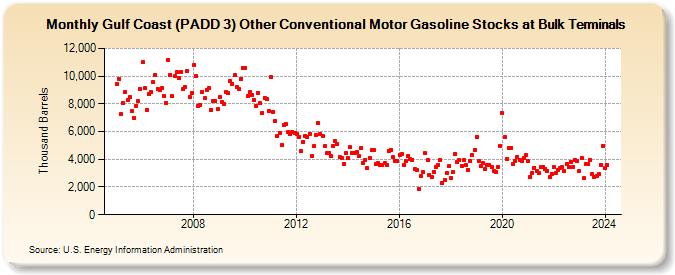
| Gulf Coast (PADD 3) Other Conventional Motor Gasoline Stocks at Bulk Terminals (Thousand Barrels) | ||||||||
| Year | Jan | Feb | Mar | Apr | May | Jun | Jul | Aug | Sep | Oct | Nov | Dec |
|---|---|---|---|---|---|---|---|---|---|---|---|---|
| 2005 | 9,425 | 9,821 | 7,236 | 8,064 | 8,852 | 8,276 | 8,463 | 7,517 | 7,001 | 7,864 | 8,201 | 9,079 |
| 2006 | 10,998 | 9,121 | 7,547 | 8,700 | 8,847 | 9,542 | 10,102 | 9,101 | 8,994 | 9,111 | 8,548 | 8,079 |
| 2007 | 11,194 | 10,083 | 8,551 | 9,987 | 10,266 | 9,843 | 10,329 | 9,055 | 9,183 | 10,347 | 8,524 | 8,763 |
| 2008 | 10,789 | 10,018 | 7,851 | 7,895 | 8,866 | 8,403 | 8,965 | 9,117 | 7,585 | 8,236 | 8,174 | 7,603 |
| 2009 | 8,507 | 8,165 | 7,995 | 8,879 | 8,760 | 9,644 | 9,458 | 10,056 | 9,230 | 9,037 | 9,824 | 10,608 |
| 2010 | 10,617 | 8,563 | 8,864 | 8,639 | 8,300 | 7,863 | 8,812 | 8,026 | 7,333 | 8,427 | 8,337 | 7,505 |
| 2011 | 9,911 | 7,415 | 6,738 | 5,660 | 5,904 | 5,034 | 6,485 | 6,565 | 5,956 | 5,839 | 5,981 | 5,903 |
| 2012 | 5,841 | 5,628 | 4,564 | 5,239 | 5,666 | 5,577 | 5,846 | 4,237 | 4,937 | 5,728 | 6,633 | 5,838 |
| 2013 | 5,654 | 4,946 | 4,431 | 4,469 | 4,215 | 4,985 | 5,311 | 5,098 | 4,139 | 4,126 | 3,683 | 4,457 |
| 2014 | 4,073 | 4,861 | 4,436 | 4,440 | 4,538 | 4,212 | 4,836 | 3,727 | 3,956 | 3,366 | 4,125 | 4,683 |
| 2015 | 4,668 | 3,642 | 3,722 | 3,578 | 3,561 | 3,710 | 3,582 | 4,581 | 4,676 | 4,141 | 3,905 | 3,861 |
| 2016 | 4,305 | 4,352 | 3,610 | 3,858 | 4,257 | 4,035 | 3,981 | 3,272 | 3,214 | 1,858 | 2,770 | 3,050 |
| 2017 | 4,421 | 3,960 | 2,891 | 2,728 | 3,101 | 3,465 | 3,606 | 3,928 | 2,288 | 2,505 | 2,991 | 3,489 |
| 2018 | 2,634 | 3,080 | 4,387 | 3,820 | 3,925 | 3,549 | 3,923 | 3,607 | 3,233 | 3,885 | 4,319 | 4,660 |
| 2019 | 5,622 | 3,853 | 3,526 | 3,717 | 3,323 | 3,571 | 3,583 | 3,436 | 3,168 | 3,113 | 3,424 | 4,975 |
| 2020 | 7,331 | 5,623 | 4,004 | 4,782 | 4,817 | 3,648 | 3,846 | 4,172 | 3,920 | 3,843 | 4,078 | 4,301 |
| 2021 | 3,842 | 2,753 | 3,035 | 3,405 | 3,134 | 3,042 | 3,410 | 3,462 | 3,318 | 3,180 | 2,732 | 2,940 |
| 2022 | 3,421 | 2,974 | 3,250 | 3,355 | 3,477 | 3,144 | 3,641 | 3,445 | 3,830 | 3,475 | 3,949 | 3,869 |
| 2023 | 3,155 | 4,092 | 2,633 | 3,628 | 3,654 | 3,967 | 2,932 | 2,726 | 2,805 | 2,925 | 3,580 | 4,988 |
| 2024 | 3,343 | |||||||||||
| - = No Data Reported; -- = Not Applicable; NA = Not Available; W = Withheld to avoid disclosure of individual company data. |
| Release Date: 3/29/2024 |
| Next Release Date: 4/30/2024 |