|
Download Data (XLS File) |
|
||||||||
|
||||||||
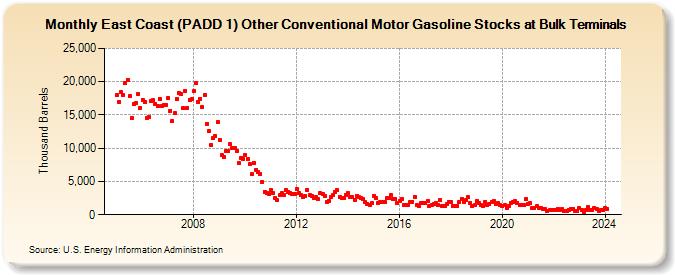
| East Coast (PADD 1) Other Conventional Motor Gasoline Stocks at Bulk Terminals (Thousand Barrels) | ||||||||
| Year | Jan | Feb | Mar | Apr | May | Jun | Jul | Aug | Sep | Oct | Nov | Dec |
|---|---|---|---|---|---|---|---|---|---|---|---|---|
| 2005 | 17,986 | 16,995 | 18,401 | 18,031 | 19,797 | 20,323 | 17,852 | 14,542 | 16,573 | 16,860 | 18,145 | 16,041 |
| 2006 | 17,295 | 16,982 | 14,593 | 14,762 | 17,019 | 17,172 | 16,683 | 16,282 | 17,462 | 16,360 | 16,513 | 16,564 |
| 2007 | 17,517 | 15,651 | 14,120 | 15,290 | 17,445 | 18,340 | 18,095 | 15,998 | 18,665 | 16,074 | 17,283 | 17,400 |
| 2008 | 18,525 | 19,749 | 16,893 | 17,453 | 16,185 | 17,997 | 13,684 | 12,523 | 10,483 | 11,581 | 11,810 | 13,955 |
| 2009 | 11,249 | 8,983 | 8,649 | 9,528 | 9,534 | 10,573 | 9,999 | 9,994 | 9,556 | 7,758 | 8,578 | 8,346 |
| 2010 | 8,987 | 8,421 | 7,593 | 6,047 | 7,816 | 6,767 | 6,402 | 6,065 | 4,943 | 3,476 | 3,323 | 3,135 |
| 2011 | 3,705 | 3,235 | 2,519 | 2,144 | 2,922 | 3,250 | 2,973 | 3,675 | 3,460 | 3,242 | 3,130 | 3,071 |
| 2012 | 3,829 | 3,255 | 2,901 | 2,591 | 2,854 | 3,727 | 2,972 | 2,776 | 2,526 | 2,620 | 2,323 | 3,246 |
| 2013 | 3,051 | 2,868 | 1,905 | 2,091 | 2,614 | 2,997 | 3,399 | 3,643 | 2,718 | 2,479 | 2,458 | 2,938 |
| 2014 | 3,287 | 2,677 | 2,665 | 2,239 | 2,869 | 2,631 | 2,442 | 2,297 | 1,856 | 1,672 | 1,515 | 1,693 |
| 2015 | 2,867 | 2,491 | 1,800 | 1,930 | 1,949 | 1,970 | 2,495 | 2,483 | 2,903 | 2,295 | 2,334 | 1,816 |
| 2016 | 2,114 | 2,411 | 1,423 | 1,484 | 1,465 | 1,850 | 1,977 | 2,683 | 1,467 | 1,348 | 1,723 | 1,734 |
| 2017 | 1,699 | 2,074 | 1,358 | 1,469 | 1,664 | 1,704 | 1,477 | 2,139 | 1,308 | 1,294 | 1,551 | 1,966 |
| 2018 | 1,846 | 1,334 | 1,298 | 1,304 | 1,899 | 2,436 | 1,963 | 2,150 | 2,591 | 1,725 | 1,357 | 1,427 |
| 2019 | 2,073 | 1,753 | 1,419 | 1,344 | 1,916 | 1,521 | 1,570 | 1,883 | 2,069 | 1,536 | 1,825 | 1,438 |
| 2020 | 1,254 | 1,421 | 1,028 | 1,365 | 1,777 | 1,941 | 2,012 | 1,763 | 1,417 | 1,491 | 1,434 | 2,328 |
| 2021 | 1,583 | 1,709 | 1,049 | 1,025 | 1,267 | 1,043 | 1,059 | 836 | 847 | 618 | 656 | 716 |
| 2022 | 758 | 692 | 921 | 771 | 830 | 623 | 613 | 777 | 915 | 903 | 608 | 521 |
| 2023 | 939 | 690 | 448 | 687 | 1,098 | 766 | 670 | 1,052 | 924 | 592 | 705 | 697 |
| 2024 | 1,064 | |||||||||||
| - = No Data Reported; -- = Not Applicable; NA = Not Available; W = Withheld to avoid disclosure of individual company data. |
| Release Date: 3/29/2024 |
| Next Release Date: 4/30/2024 |