|
Download Data (XLS File) |
|
||||||||
|
||||||||
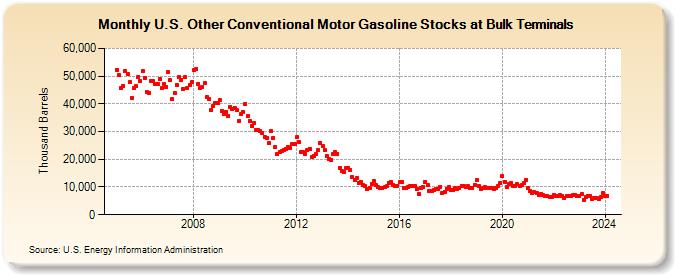
| U.S. Other Conventional Motor Gasoline Stocks at Bulk Terminals (Thousand Barrels) | ||||||||
| Year | Jan | Feb | Mar | Apr | May | Jun | Jul | Aug | Sep | Oct | Nov | Dec |
|---|---|---|---|---|---|---|---|---|---|---|---|---|
| 2005 | 52,303 | 50,352 | 45,691 | 46,582 | 51,672 | 50,876 | 47,742 | 42,151 | 45,733 | 46,255 | 49,819 | 48,199 |
| 2006 | 51,833 | 49,430 | 44,343 | 44,003 | 48,335 | 48,085 | 47,131 | 47,156 | 48,973 | 45,561 | 47,285 | 46,068 |
| 2007 | 51,422 | 48,447 | 41,565 | 43,800 | 46,834 | 49,777 | 48,744 | 45,460 | 49,554 | 45,771 | 46,649 | 47,752 |
| 2008 | 52,266 | 52,677 | 47,309 | 45,651 | 46,027 | 47,514 | 42,319 | 41,689 | 37,701 | 39,276 | 40,255 | 40,357 |
| 2009 | 41,264 | 37,433 | 36,316 | 37,158 | 35,684 | 38,808 | 38,054 | 38,619 | 37,681 | 33,843 | 36,245 | 37,033 |
| 2010 | 39,889 | 35,534 | 33,916 | 31,855 | 33,220 | 30,713 | 30,469 | 30,054 | 29,507 | 28,042 | 27,846 | 25,809 |
| 2011 | 30,054 | 27,649 | 24,338 | 21,743 | 22,449 | 22,851 | 23,391 | 23,785 | 24,354 | 23,963 | 25,508 | 25,630 |
| 2012 | 27,902 | 26,305 | 22,511 | 22,576 | 21,981 | 23,266 | 23,829 | 20,874 | 21,308 | 21,789 | 23,449 | 25,967 |
| 2013 | 24,950 | 23,457 | 21,196 | 19,967 | 19,911 | 22,023 | 22,576 | 22,044 | 16,966 | 15,706 | 15,535 | 16,753 |
| 2014 | 16,876 | 16,163 | 13,635 | 12,422 | 13,191 | 11,550 | 11,942 | 10,617 | 10,291 | 9,154 | 9,805 | 11,235 |
| 2015 | 12,179 | 10,764 | 9,826 | 9,552 | 9,476 | 9,888 | 10,203 | 11,507 | 11,810 | 10,693 | 10,452 | 10,406 |
| 2016 | 11,699 | 11,737 | 9,683 | 9,664 | 10,008 | 10,292 | 10,341 | 10,204 | 9,112 | 7,626 | 9,733 | 9,897 |
| 2017 | 11,784 | 10,644 | 8,450 | 8,421 | 9,017 | 9,276 | 9,224 | 10,141 | 7,925 | 8,341 | 9,300 | 9,939 |
| 2018 | 8,985 | 8,924 | 9,570 | 9,390 | 9,773 | 10,364 | 10,305 | 9,878 | 10,223 | 9,623 | 9,751 | 10,660 |
| 2019 | 12,633 | 10,449 | 9,321 | 9,588 | 9,853 | 9,698 | 9,709 | 9,789 | 9,387 | 9,493 | 10,272 | 11,540 |
| 2020 | 13,880 | 11,967 | 9,927 | 10,982 | 11,524 | 10,485 | 10,464 | 10,943 | 10,387 | 10,739 | 11,479 | 12,697 |
| 2021 | 9,695 | 8,610 | 7,845 | 8,116 | 7,957 | 6,967 | 7,472 | 7,016 | 6,661 | 6,595 | 6,350 | 6,396 |
| 2022 | 7,241 | 6,810 | 6,806 | 7,092 | 6,902 | 6,122 | 6,731 | 6,758 | 6,913 | 6,971 | 7,039 | 6,821 |
| 2023 | 6,256 | 7,062 | 5,049 | 6,236 | 6,846 | 6,858 | 5,630 | 6,671 | 6,539 | 5,802 | 6,380 | 7,898 |
| 2024 | 6,670 | 6,730 | 5,929 | 6,827 | 6,893 | 6,584 | ||||||
| - = No Data Reported; -- = Not Applicable; NA = Not Available; W = Withheld to avoid disclosure of individual company data. |
| Release Date: 8/30/2024 |
| Next Release Date: 9/30/2024 |