|
Download Data (XLS File) |
|
||||||||
|
||||||||
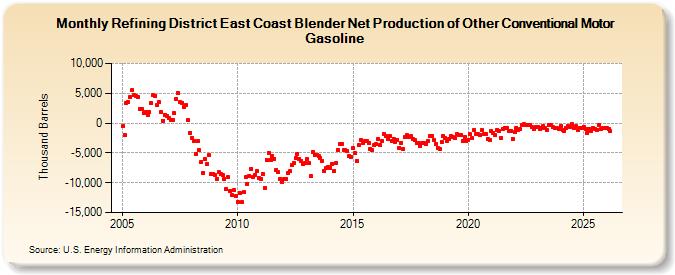
| Refining District East Coast Blender Net Production of Other Conventional Motor Gasoline (Thousand Barrels) | ||||||||
| Year | Jan | Feb | Mar | Apr | May | Jun | Jul | Aug | Sep | Oct | Nov | Dec |
|---|---|---|---|---|---|---|---|---|---|---|---|---|
| 2005 | -555 | -2,062 | 3,378 | 3,464 | 4,457 | 5,545 | 4,711 | 4,596 | 4,429 | 2,389 | 2,286 | 1,717 |
| 2006 | 1,882 | 1,327 | 1,835 | 3,332 | 4,650 | 4,541 | 2,959 | 3,486 | 1,810 | 438 | 1,444 | 1,271 |
| 2007 | 829 | 568 | 459 | 1,634 | 4,085 | 5,036 | 3,504 | 3,453 | 2,771 | 3,026 | 486 | -1,607 |
| 2008 | -2,455 | -2,921 | -5,192 | -3,007 | -4,577 | -6,444 | -8,295 | -6,032 | -6,838 | -5,397 | -8,557 | -8,525 |
| 2009 | -8,744 | -9,329 | -8,215 | -8,533 | -8,739 | -9,424 | -11,022 | -9,092 | -11,326 | -12,114 | -11,197 | -12,155 |
| 2010 | -13,158 | -11,688 | -13,289 | -11,588 | -9,094 | -10,164 | -8,792 | -7,619 | -8,979 | -8,659 | -8,103 | -9,198 |
| 2011 | -9,301 | -8,501 | -10,803 | -6,172 | -4,964 | -6,108 | -5,478 | -5,945 | -7,855 | -8,278 | -9,405 | -9,805 |
| 2012 | -9,297 | -9,364 | -8,405 | -8,069 | -7,100 | -6,706 | -5,895 | -5,136 | -6,016 | -6,309 | -6,808 | -6,634 |
| 2013 | -6,043 | -6,657 | -8,905 | -4,816 | -5,299 | -5,338 | -5,481 | -5,912 | -6,285 | -8,022 | -7,513 | -7,345 |
| 2014 | -7,488 | -6,843 | -8,046 | -6,725 | -4,496 | -3,519 | -3,423 | -4,443 | -4,471 | -4,683 | -5,596 | -5,705 |
| 2015 | -4,184 | -5,040 | -6,310 | -3,748 | -2,813 | -3,267 | -3,072 | -3,053 | -3,256 | -4,296 | -4,527 | -3,717 |
| 2016 | -3,550 | -2,653 | -3,626 | -3,025 | -1,761 | -2,084 | -2,598 | -2,221 | -2,955 | -2,582 | -3,105 | -2,796 |
| 2017 | -4,153 | -3,255 | -4,268 | -2,366 | -2,040 | -2,364 | -2,244 | -2,696 | -2,905 | -3,306 | -3,291 | -3,807 |
| 2018 | -3,359 | -3,278 | -3,489 | -3,006 | -2,226 | -2,113 | -2,822 | -3,474 | -4,158 | -4,286 | -3,128 | -2,157 |
| 2019 | -2,456 | -2,947 | -2,592 | -2,166 | -2,383 | -2,509 | -1,831 | -1,965 | -2,015 | -2,987 | -2,255 | -2,927 |
| 2020 | -2,773 | -1,875 | -2,501 | -1,236 | -1,766 | -1,859 | -1,942 | -1,159 | -1,803 | -1,854 | -2,581 | -2,904 |
| 2021 | -1,324 | -1,576 | -1,925 | -1,102 | -1,307 | -2,422 | -1,025 | -768 | -769 | -1,268 | -1,310 | -2,642 |
| 2022 | -1,567 | -743 | -1,083 | -1,067 | -353 | -217 | -272 | -329 | -391 | -721 | -1,068 | -717 |
| 2023 | -732 | -950 | -858 | -529 | -847 | -1,096 | -398 | -335 | -725 | -784 | -741 | -955 |
| 2024 | -500 | -1,091 | -1,367 | -773 | -512 | -641 | ||||||
| - = No Data Reported; -- = Not Applicable; NA = Not Available; W = Withheld to avoid disclosure of individual company data. |
| Release Date: 8/30/2024 |
| Next Release Date: 9/30/2024 |