|
Download Data (XLS File) |
|
||||||||
|
||||||||
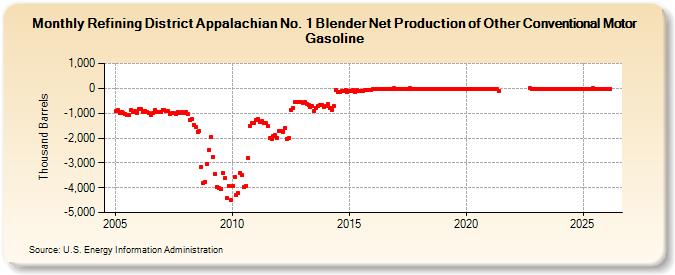
| Refining District Appalachian No. 1 Blender Net Production of Other Conventional Motor Gasoline (Thousand Barrels) | ||||||||
| Year | Jan | Feb | Mar | Apr | May | Jun | Jul | Aug | Sep | Oct | Nov | Dec |
|---|---|---|---|---|---|---|---|---|---|---|---|---|
| 2005 | -915 | -886 | -991 | -939 | -1,003 | -1,021 | -1,054 | -1,089 | -878 | -935 | -925 | -975 |
| 2006 | -841 | -827 | -952 | -896 | -941 | -973 | -1,059 | -1,012 | -891 | -970 | -945 | -963 |
| 2007 | -853 | -872 | -918 | -923 | -1,046 | -988 | -1,008 | -1,048 | -953 | -975 | -941 | -981 |
| 2008 | -952 | -1,022 | -1,272 | -1,238 | -1,468 | -1,552 | -1,763 | -1,732 | -3,162 | -3,813 | -3,756 | -3,049 |
| 2009 | -2,464 | -1,965 | -2,759 | -3,442 | -3,966 | -4,027 | -4,033 | -3,415 | -3,618 | -4,423 | -3,925 | -4,483 |
| 2010 | -3,916 | -3,560 | -4,277 | -4,207 | -3,395 | -3,491 | -3,955 | -3,915 | -2,817 | -1,509 | -1,414 | -1,405 |
| 2011 | -1,275 | -1,229 | -1,374 | -1,326 | -1,402 | -1,390 | -1,514 | -2,019 | -2,029 | -1,929 | -1,887 | -2,006 |
| 2012 | -1,734 | -1,713 | -1,744 | -1,595 | -2,024 | -1,994 | -870 | -782 | -566 | -566 | -548 | -540 |
| 2013 | -577 | -563 | -611 | -680 | -746 | -729 | -899 | -808 | -699 | -661 | -673 | -733 |
| 2014 | -705 | -645 | -789 | -854 | -715 | -83 | -154 | -156 | -109 | -104 | -83 | -132 |
| 2015 | -89 | -117 | -81 | -161 | -77 | -95 | -89 | -119 | -79 | -79 | -57 | -86 |
| 2016 | -18 | -23 | -23 | -21 | -12 | -7 | -9 | -12 | -14 | -12 | -11 | 3 |
| 2017 | -8 | -12 | -17 | -15 | -13 | -7 | -10 | -6 | -10 | -14 | -14 | -10 |
| 2018 | -9 | -9 | -12 | -14 | -10 | -8 | -8 | -7 | -15 | -14 | -10 | -11 |
| 2019 | -9 | -11 | -14 | -15 | -9 | -13 | -20 | -35 | -37 | -34 | -30 | -28 |
| 2020 | -29 | -24 | -24 | -18 | -25 | -38 | -42 | -39 | -41 | -37 | -32 | -29 |
| 2021 | -29 | -28 | -33 | -46 | -38 | -88 | ||||||
| 2022 | -2 | -9 | -9 | |||||||||
| 2023 | -33 | -25 | -26 | -20 | -25 | -45 | -40 | -24 | -14 | -29 | -32 | -26 |
| 2024 | -25 | |||||||||||
| - = No Data Reported; -- = Not Applicable; NA = Not Available; W = Withheld to avoid disclosure of individual company data. |
| Release Date: 3/29/2024 |
| Next Release Date: 4/30/2024 |