|
Download Data (XLS File) |
|
||||||||
|
||||||||
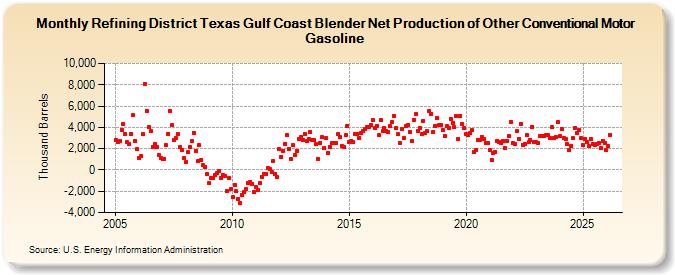
| Refining District Texas Gulf Coast Blender Net Production of Other Conventional Motor Gasoline (Thousand Barrels) | ||||||||
| Year | Jan | Feb | Mar | Apr | May | Jun | Jul | Aug | Sep | Oct | Nov | Dec |
|---|---|---|---|---|---|---|---|---|---|---|---|---|
| 2005 | 2,849 | 2,640 | 2,688 | 3,785 | 4,343 | 3,382 | 2,585 | 2,448 | 3,393 | 5,154 | 2,757 | 1,981 |
| 2006 | 1,146 | 1,294 | 3,357 | 8,082 | 5,563 | 3,998 | 3,621 | 2,147 | 2,468 | 2,139 | 1,397 | 1,116 |
| 2007 | 1,002 | 1,049 | 2,299 | 3,421 | 5,558 | 4,185 | 2,825 | 2,973 | 3,390 | 2,133 | 1,862 | 1,086 |
| 2008 | 723 | 1,649 | 2,121 | 2,702 | 3,512 | 1,791 | 828 | 2,338 | 967 | 431 | 286 | -396 |
| 2009 | -1,234 | -724 | -739 | -440 | -294 | -90 | -725 | -428 | -550 | -1,957 | -789 | -1,808 |
| 2010 | -2,559 | -1,394 | -1,986 | -2,726 | -3,140 | -2,337 | -2,086 | -1,772 | -1,263 | -1,130 | -1,314 | -2,036 |
| 2011 | -1,640 | -1,845 | -1,202 | -641 | -334 | -358 | 215 | 89 | -167 | 803 | -350 | -689 |
| 2012 | 1,929 | 1,254 | 1,811 | 2,466 | 3,241 | 1,994 | 1,058 | 2,345 | 1,367 | 1,818 | 2,948 | 3,114 |
| 2013 | 2,821 | 3,391 | 2,685 | 2,875 | 3,558 | 2,815 | 2,811 | 2,402 | 1,032 | 2,569 | 3,052 | 2,079 |
| 2014 | 2,996 | 1,574 | 2,172 | 2,497 | 2,550 | 2,575 | 3,357 | 3,076 | 2,252 | 2,199 | 3,247 | 4,143 |
| 2015 | 2,655 | 2,752 | 2,600 | 3,404 | 3,381 | 3,028 | 3,508 | 3,701 | 3,852 | 3,993 | 4,035 | 4,204 |
| 2016 | 4,721 | 3,899 | 4,152 | 3,239 | 4,658 | 3,628 | 3,950 | 3,629 | 3,561 | 4,100 | 4,491 | 5,076 |
| 2017 | 3,923 | 3,359 | 2,520 | 3,826 | 2,982 | 4,097 | 4,201 | 3,612 | 2,742 | 4,730 | 5,253 | 3,656 |
| 2018 | 3,950 | 3,390 | 4,636 | 3,496 | 3,616 | 5,506 | 5,296 | 3,550 | 4,116 | 4,913 | 4,244 | 4,267 |
| 2019 | 3,725 | 3,219 | 4,088 | 3,918 | 4,823 | 4,426 | 3,999 | 5,023 | 2,943 | 5,095 | 4,328 | 3,945 |
| 2020 | 3,346 | 3,283 | 3,442 | 3,720 | 1,709 | 1,843 | 2,853 | 2,822 | 3,141 | 2,867 | 2,553 | 2,524 |
| 2021 | 1,911 | 965 | 1,580 | 1,707 | 2,752 | 2,661 | 2,562 | 2,761 | 2,031 | 2,748 | 3,161 | 4,514 |
| 2022 | 2,493 | 2,476 | 3,658 | 2,934 | 4,318 | 2,385 | 2,485 | 3,298 | 2,588 | 2,833 | 4,035 | 2,673 |
| 2023 | 2,588 | 2,489 | 3,165 | 3,147 | 3,223 | 3,267 | 3,240 | 2,994 | 4,020 | 3,016 | 3,061 | 4,484 |
| 2024 | 3,169 | |||||||||||
| - = No Data Reported; -- = Not Applicable; NA = Not Available; W = Withheld to avoid disclosure of individual company data. |
| Release Date: 3/29/2024 |
| Next Release Date: 4/30/2024 |