|
Download Data (XLS File) |
|
||||||||
|
||||||||
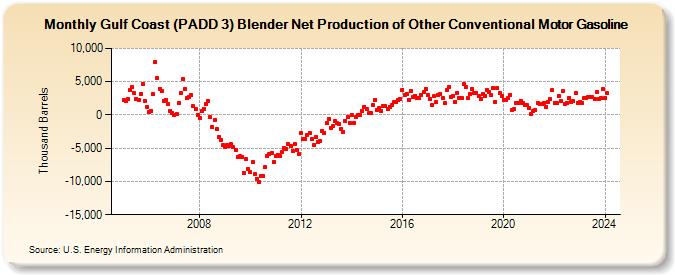
| Gulf Coast (PADD 3) Blender Net Production of Other Conventional Motor Gasoline (Thousand Barrels) | ||||||||
| Year | Jan | Feb | Mar | Apr | May | Jun | Jul | Aug | Sep | Oct | Nov | Dec |
|---|---|---|---|---|---|---|---|---|---|---|---|---|
| 2005 | 2,193 | 2,038 | 2,413 | 3,686 | 4,210 | 3,248 | 2,429 | 2,295 | 3,204 | 4,627 | 2,045 | 1,219 |
| 2006 | 414 | 645 | 3,112 | 8,004 | 5,475 | 3,928 | 3,553 | 2,058 | 2,294 | 1,602 | 566 | 313 |
| 2007 | 35 | 169 | 1,806 | 3,248 | 5,369 | 3,921 | 2,500 | 2,625 | 2,936 | 1,284 | 883 | 51 |
| 2008 | -487 | 522 | 880 | 1,668 | 2,087 | -317 | -1,858 | -777 | -2,076 | -3,265 | -3,725 | -4,506 |
| 2009 | -4,779 | -4,560 | -4,601 | -4,435 | -4,887 | -5,217 | -6,274 | -6,206 | -6,258 | -8,749 | -6,640 | -8,115 |
| 2010 | -8,625 | -7,113 | -8,893 | -9,578 | -10,139 | -9,249 | -9,146 | -7,844 | -6,235 | -5,942 | -5,730 | -7,018 |
| 2011 | -6,179 | -5,964 | -6,179 | -5,527 | -5,010 | -5,056 | -4,360 | -4,685 | -5,372 | -4,382 | -5,214 | -5,922 |
| 2012 | -2,733 | -3,652 | -3,670 | -2,954 | -2,686 | -3,625 | -4,501 | -3,325 | -4,085 | -3,894 | -2,416 | -2,669 |
| 2013 | -1,264 | -560 | -1,917 | -1,645 | -983 | -1,268 | -1,427 | -2,045 | -2,518 | -924 | -248 | -1,175 |
| 2014 | 19 | -1,179 | -350 | -54 | 31 | 518 | 1,255 | 961 | 214 | 289 | 1,490 | 2,261 |
| 2015 | 804 | 987 | 597 | 1,369 | 1,282 | 841 | 1,233 | 1,495 | 1,901 | 1,953 | 2,223 | 2,407 |
| 2016 | 3,760 | 2,949 | 3,185 | 2,272 | 3,649 | 2,672 | 2,882 | 2,548 | 2,525 | 2,975 | 3,405 | 3,968 |
| 2017 | 2,959 | 2,401 | 1,431 | 2,791 | 1,901 | 3,055 | 3,135 | 2,543 | 1,724 | 3,716 | 4,261 | 2,626 |
| 2018 | 2,907 | 2,014 | 3,362 | 2,500 | 2,614 | 4,608 | 4,245 | 2,486 | 3,154 | 3,926 | 3,361 | 3,265 |
| 2019 | 2,799 | 2,332 | 3,153 | 2,805 | 3,790 | 3,445 | 2,958 | 3,974 | 1,975 | 4,031 | 3,293 | 2,918 |
| 2020 | 2,286 | 2,254 | 2,504 | 3,050 | 790 | 847 | 1,786 | 1,795 | 2,163 | 1,819 | 1,566 | 1,430 |
| 2021 | 1,000 | 141 | 562 | 732 | 1,773 | 1,709 | 1,638 | 1,862 | 1,231 | 1,874 | 2,337 | 3,705 |
| 2022 | 1,719 | 1,780 | 2,853 | 2,165 | 3,548 | 1,654 | 1,745 | 2,549 | 1,872 | 2,029 | 3,342 | 1,864 |
| 2023 | 1,868 | 1,845 | 2,472 | 2,572 | 2,668 | 2,715 | 2,665 | 2,384 | 3,461 | 2,422 | 2,478 | 3,871 |
| 2024 | 2,597 | 3,234 | ||||||||||
| - = No Data Reported; -- = Not Applicable; NA = Not Available; W = Withheld to avoid disclosure of individual company data. |
| Release Date: 4/30/2024 |
| Next Release Date: 5/31/2024 |