|
Download Data (XLS File) |
|
||||||||
|
||||||||
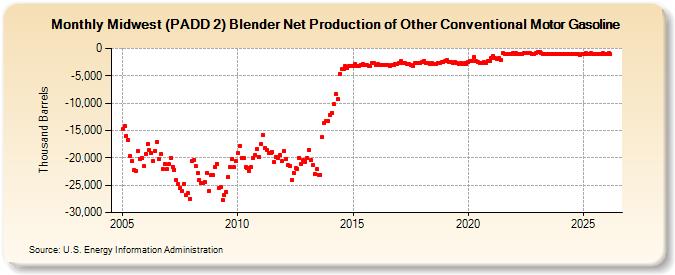
| Midwest (PADD 2) Blender Net Production of Other Conventional Motor Gasoline (Thousand Barrels) | ||||||||
| Year | Jan | Feb | Mar | Apr | May | Jun | Jul | Aug | Sep | Oct | Nov | Dec |
|---|---|---|---|---|---|---|---|---|---|---|---|---|
| 2005 | -14,809 | -14,209 | -15,931 | -16,831 | -19,670 | -20,572 | -22,240 | -22,337 | -18,788 | -20,129 | -20,070 | -21,567 |
| 2006 | -19,371 | -17,449 | -18,595 | -19,203 | -20,544 | -18,717 | -17,020 | -20,299 | -19,314 | -22,056 | -21,115 | -22,117 |
| 2007 | -21,150 | -19,943 | -21,612 | -22,160 | -24,093 | -24,770 | -25,435 | -26,085 | -24,720 | -26,870 | -26,450 | -27,488 |
| 2008 | -20,580 | -20,457 | -21,561 | -22,830 | -24,039 | -24,556 | -24,656 | -24,487 | -22,708 | -26,061 | -23,160 | -23,167 |
| 2009 | -21,682 | -21,036 | -25,442 | -25,383 | -27,674 | -26,786 | -26,230 | -23,454 | -21,705 | -20,258 | -21,683 | -20,551 |
| 2010 | -19,156 | -17,795 | -19,977 | -20,079 | -21,680 | -21,784 | -22,341 | -21,688 | -19,997 | -19,491 | -18,457 | -19,774 |
| 2011 | -17,471 | -15,751 | -18,164 | -18,518 | -19,156 | -19,184 | -18,936 | -20,752 | -19,782 | -20,089 | -19,519 | -20,660 |
| 2012 | -18,710 | -20,141 | -21,362 | -21,439 | -24,063 | -22,687 | -21,939 | -21,966 | -19,980 | -21,132 | -20,449 | -20,693 |
| 2013 | -19,958 | -18,542 | -20,461 | -21,359 | -22,902 | -22,122 | -23,136 | -23,059 | -16,271 | -13,614 | -13,215 | -13,250 |
| 2014 | -12,135 | -11,720 | -10,244 | -8,386 | -9,299 | -4,666 | -3,834 | -3,777 | -3,288 | -3,497 | -3,184 | -3,286 |
| 2015 | -3,240 | -2,865 | -3,216 | -3,305 | -2,975 | -2,853 | -3,099 | -3,109 | -3,140 | -3,202 | -2,587 | -2,732 |
| 2016 | -2,971 | -2,875 | -3,063 | -2,951 | -3,021 | -3,046 | -3,119 | -3,275 | -3,049 | -3,122 | -2,911 | -2,861 |
| 2017 | -2,626 | -2,362 | -2,649 | -2,601 | -2,918 | -2,925 | -3,001 | -3,167 | -2,728 | -2,703 | -2,605 | -2,633 |
| 2018 | -2,525 | -2,301 | -2,638 | -2,583 | -2,888 | -2,735 | -2,805 | -2,919 | -2,640 | -2,661 | -2,514 | -2,512 |
| 2019 | -2,341 | -2,139 | -2,462 | -2,415 | -2,608 | -2,511 | -2,753 | -2,868 | -2,672 | -2,837 | -2,756 | -2,824 |
| 2020 | -2,570 | -2,278 | -2,265 | -1,528 | -2,281 | -2,535 | -2,712 | -2,675 | -2,561 | -2,618 | -2,342 | -2,362 |
| 2021 | -1,736 | -1,462 | -1,810 | -1,874 | -1,800 | -2,144 | -868 | -947 | -1,010 | -1,024 | -937 | -922 |
| 2022 | -939 | -908 | -1,090 | -954 | -960 | -862 | -887 | -905 | -929 | -978 | -975 | -899 |
| 2023 | -648 | -611 | -953 | -1,049 | -1,061 | -1,005 | -996 | -1,073 | -1,040 | -1,066 | -1,078 | -1,074 |
| 2024 | -974 | |||||||||||
| - = No Data Reported; -- = Not Applicable; NA = Not Available; W = Withheld to avoid disclosure of individual company data. |
| Release Date: 3/29/2024 |
| Next Release Date: 4/30/2024 |