|
Download Data (XLS File) |
|
||||||||
|
||||||||
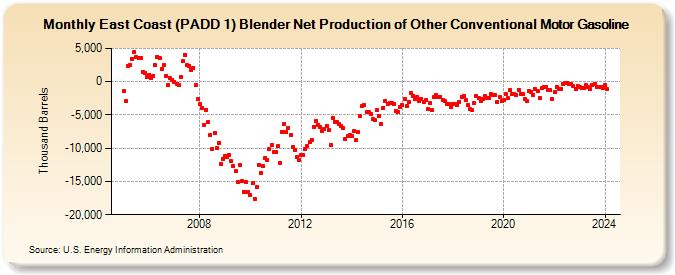
| East Coast (PADD 1) Blender Net Production of Other Conventional Motor Gasoline (Thousand Barrels) | ||||||||
| Year | Jan | Feb | Mar | Apr | May | Jun | Jul | Aug | Sep | Oct | Nov | Dec |
|---|---|---|---|---|---|---|---|---|---|---|---|---|
| 2005 | -1,470 | -2,948 | 2,387 | 2,525 | 3,454 | 4,524 | 3,657 | 3,507 | 3,551 | 1,454 | 1,361 | 742 |
| 2006 | 1,041 | 500 | 883 | 2,436 | 3,709 | 3,568 | 1,900 | 2,474 | 919 | -532 | 499 | 308 |
| 2007 | -24 | -304 | -459 | 711 | 3,039 | 4,048 | 2,496 | 2,405 | 1,818 | 2,051 | -455 | -2,588 |
| 2008 | -3,407 | -3,943 | -6,464 | -4,245 | -6,045 | -7,996 | -10,058 | -7,764 | -10,000 | -9,210 | -12,313 | -11,574 |
| 2009 | -11,208 | -11,294 | -10,974 | -11,975 | -12,705 | -13,451 | -15,055 | -12,507 | -14,944 | -16,537 | -15,122 | -16,638 |
| 2010 | -17,074 | -15,248 | -17,566 | -15,795 | -12,489 | -13,655 | -12,747 | -11,534 | -11,796 | -10,168 | -9,517 | -10,603 |
| 2011 | -10,576 | -9,730 | -12,177 | -7,498 | -6,366 | -7,498 | -6,992 | -7,964 | -9,884 | -10,207 | -11,292 | -11,811 |
| 2012 | -11,031 | -11,077 | -10,149 | -9,664 | -9,124 | -8,700 | -6,765 | -5,918 | -6,582 | -6,875 | -7,356 | -7,174 |
| 2013 | -6,620 | -7,220 | -9,516 | -5,496 | -6,045 | -6,067 | -6,380 | -6,720 | -6,984 | -8,683 | -8,186 | -8,078 |
| 2014 | -8,193 | -7,488 | -8,835 | -7,579 | -5,211 | -3,602 | -3,577 | -4,599 | -4,580 | -4,787 | -5,679 | -5,837 |
| 2015 | -4,273 | -5,157 | -6,391 | -3,909 | -2,890 | -3,362 | -3,161 | -3,172 | -3,335 | -4,375 | -4,584 | -3,803 |
| 2016 | -3,568 | -2,676 | -3,649 | -3,046 | -1,773 | -2,091 | -2,607 | -2,233 | -2,969 | -2,594 | -3,116 | -2,793 |
| 2017 | -4,161 | -3,267 | -4,285 | -2,381 | -2,053 | -2,371 | -2,254 | -2,702 | -2,915 | -3,320 | -3,305 | -3,817 |
| 2018 | -3,368 | -3,287 | -3,501 | -3,020 | -2,236 | -2,121 | -2,830 | -3,481 | -4,173 | -4,300 | -3,138 | -2,168 |
| 2019 | -2,465 | -2,958 | -2,606 | -2,181 | -2,392 | -2,522 | -1,851 | -2,000 | -2,052 | -3,021 | -2,285 | -2,955 |
| 2020 | -2,802 | -1,899 | -2,525 | -1,254 | -1,791 | -1,897 | -1,984 | -1,198 | -1,844 | -1,891 | -2,613 | -2,933 |
| 2021 | -1,353 | -1,604 | -1,958 | -1,148 | -1,345 | -2,510 | -1,025 | -768 | -769 | -1,268 | -1,310 | -2,642 |
| 2022 | -1,567 | -743 | -1,083 | -1,067 | -353 | -217 | -272 | -329 | -391 | -723 | -1,077 | -726 |
| 2023 | -765 | -975 | -884 | -549 | -872 | -1,141 | -438 | -359 | -739 | -813 | -773 | -981 |
| 2024 | -525 | |||||||||||
| - = No Data Reported; -- = Not Applicable; NA = Not Available; W = Withheld to avoid disclosure of individual company data. |
| Release Date: 3/29/2024 |
| Next Release Date: 4/30/2024 |