|
Download Data (XLS File) |
|
||||||||
|
||||||||
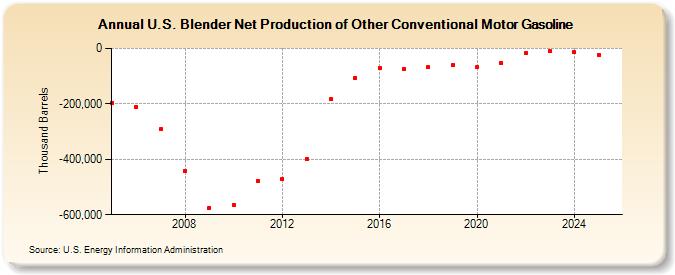
| U.S. Blender Net Production of Other Conventional Motor Gasoline (Thousand Barrels) | ||||||||
| Decade | Year-0 | Year-1 | Year-2 | Year-3 | Year-4 | Year-5 | Year-6 | Year-7 | Year-8 | Year-9 |
|---|---|---|---|---|---|---|---|---|---|---|
| 2000's | -196,719 | -212,140 | -291,471 | -441,205 | -574,004 | |||||
| 2010's | -564,715 | -477,546 | -471,358 | -398,612 | -183,454 | -105,161 | -71,577 | -74,338 | -68,527 | -59,717 |
| 2020's | -68,257 | -51,188 | -16,326 | -11,819 |
| - = No Data Reported; -- = Not Applicable; NA = Not Available; W = Withheld to avoid disclosure of individual company data. |
| Release Date: 3/29/2024 |
| Next Release Date: 8/30/2024 |