|
Download Data (XLS File) |
|
||||||||
|
||||||||
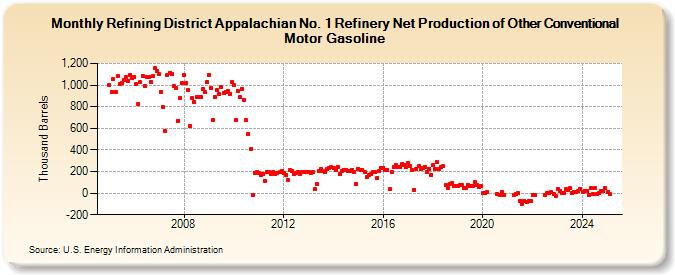
| Refining District Appalachian No. 1 Refinery Net Production of Other Conventional Motor Gasoline (Thousand Barrels) | ||||||||
| Year | Jan | Feb | Mar | Apr | May | Jun | Jul | Aug | Sep | Oct | Nov | Dec |
|---|---|---|---|---|---|---|---|---|---|---|---|---|
| 2005 | 1,005 | 935 | 1,060 | 938 | 1,085 | 1,011 | 1,020 | 1,047 | 1,074 | 1,034 | 1,097 | 1,066 |
| 2006 | 1,076 | 1,007 | 829 | 1,024 | 1,087 | 993 | 1,073 | 1,071 | 1,028 | 1,081 | 1,155 | 1,130 |
| 2007 | 1,102 | 938 | 796 | 571 | 1,096 | 1,112 | 1,103 | 993 | 973 | 672 | 883 | 1,022 |
| 2008 | 1,093 | 1,015 | 954 | 622 | 881 | 844 | 893 | 887 | 886 | 967 | 937 | 1,029 |
| 2009 | 1,095 | 977 | 673 | 889 | 959 | 915 | 984 | 926 | 937 | 944 | 921 | 1,028 |
| 2010 | 1,000 | 677 | 947 | 888 | 968 | 861 | 675 | 550 | 407 | -14 | 190 | 191 |
| 2011 | 187 | 167 | 181 | 113 | 198 | 193 | 176 | 191 | 181 | 184 | 192 | 204 |
| 2012 | 186 | 169 | 121 | 215 | 201 | 181 | 190 | 193 | 175 | 192 | 195 | 195 |
| 2013 | 200 | 188 | 195 | 35 | 81 | 209 | 220 | 209 | 196 | 220 | 229 | 241 |
| 2014 | 237 | 217 | 243 | 175 | 202 | 218 | 213 | 208 | 207 | 217 | 195 | 87 |
| 2015 | 223 | 213 | 212 | 196 | 153 | 164 | 179 | 198 | 196 | 143 | 205 | 237 |
| 2016 | 235 | 213 | 217 | 35 | 192 | 243 | 256 | 240 | 243 | 271 | 263 | 239 |
| 2017 | 276 | 252 | 216 | 32 | 223 | 250 | 227 | 229 | 244 | 198 | 227 | 167 |
| 2018 | 256 | 226 | 284 | 222 | 242 | 248 | 74 | 51 | 85 | 93 | 68 | 67 |
| 2019 | 64 | 72 | 75 | 44 | 48 | 79 | 67 | 69 | 105 | 78 | 59 | 70 |
| 2020 | 0 | 0 | 8 | -11 | -13 | 14 | -19 | |||||
| 2021 | -17 | -10 | -2 | -70 | -101 | -69 | -82 | -72 | -70 | |||
| 2022 | -18 | -14 | -15 | 3 | 5 | 10 | -6 | -24 | ||||
| 2023 | 37 | 24 | 4 | 4 | 35 | 27 | 43 | 4 | 9 | 13 | 20 | 38 |
| 2024 | 13 | |||||||||||
| - = No Data Reported; -- = Not Applicable; NA = Not Available; W = Withheld to avoid disclosure of individual company data. |
| Release Date: 3/29/2024 |
| Next Release Date: 4/30/2024 |