|
Download Data (XLS File) |
|
||||||||
|
||||||||
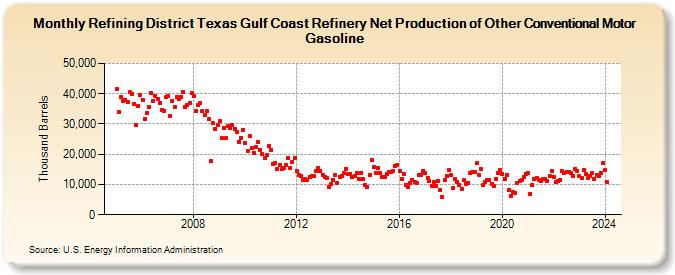
| Refining District Texas Gulf Coast Refinery Net Production of Other Conventional Motor Gasoline (Thousand Barrels) | ||||||||
| Year | Jan | Feb | Mar | Apr | May | Jun | Jul | Aug | Sep | Oct | Nov | Dec |
|---|---|---|---|---|---|---|---|---|---|---|---|---|
| 2005 | 41,683 | 33,975 | 38,812 | 37,747 | 38,048 | 37,100 | 40,425 | 39,977 | 36,756 | 29,522 | 36,014 | 39,637 |
| 2006 | 37,919 | 31,768 | 33,631 | 35,733 | 40,247 | 37,713 | 39,154 | 38,266 | 36,822 | 34,645 | 34,349 | 38,814 |
| 2007 | 39,276 | 32,533 | 37,637 | 35,612 | 38,766 | 38,172 | 39,036 | 40,716 | 35,492 | 36,236 | 36,831 | 40,131 |
| 2008 | 39,136 | 34,251 | 36,387 | 36,775 | 34,149 | 32,977 | 34,235 | 31,555 | 17,916 | 30,204 | 28,355 | 29,612 |
| 2009 | 31,008 | 25,359 | 28,686 | 25,228 | 29,273 | 28,542 | 29,651 | 28,499 | 27,297 | 24,148 | 25,373 | 28,022 |
| 2010 | 23,682 | 21,045 | 26,106 | 22,195 | 20,482 | 22,505 | 24,122 | 21,542 | 20,017 | 18,709 | 19,601 | 22,748 |
| 2011 | 21,557 | 16,746 | 17,023 | 15,073 | 16,579 | 14,981 | 15,365 | 16,481 | 18,768 | 15,586 | 17,412 | 18,594 |
| 2012 | 14,447 | 13,116 | 12,940 | 11,450 | 11,905 | 11,483 | 12,621 | 12,680 | 12,683 | 14,460 | 15,571 | 14,375 |
| 2013 | 13,289 | 12,466 | 12,061 | 9,291 | 10,047 | 11,624 | 13,091 | 10,516 | 12,612 | 12,677 | 13,652 | 15,233 |
| 2014 | 13,569 | 13,490 | 12,525 | 12,724 | 13,716 | 11,695 | 13,875 | 11,677 | 9,824 | 9,201 | 13,252 | 17,963 |
| 2015 | 15,730 | 13,926 | 15,429 | 13,869 | 12,490 | 12,309 | 13,609 | 14,269 | 14,112 | 14,410 | 16,063 | 16,580 |
| 2016 | 14,566 | 11,764 | 13,446 | 9,984 | 9,264 | 10,624 | 11,597 | 10,926 | 10,496 | 13,191 | 13,186 | 14,566 |
| 2017 | 13,770 | 12,236 | 11,224 | 9,475 | 10,949 | 9,572 | 11,155 | 8,232 | 5,815 | 11,533 | 12,895 | 14,723 |
| 2018 | 13,162 | 8,961 | 11,810 | 10,967 | 9,884 | 8,626 | 11,370 | 10,205 | 10,508 | 13,727 | 14,152 | 14,023 |
| 2019 | 16,941 | 12,988 | 15,204 | 9,721 | 10,886 | 11,501 | 11,373 | 10,292 | 9,348 | 11,827 | 13,724 | 14,826 |
| 2020 | 13,616 | 11,794 | 13,156 | 8,243 | 6,291 | 7,404 | 7,331 | 10,350 | 11,079 | 11,493 | 12,497 | 13,406 |
| 2021 | 13,793 | 6,994 | 9,871 | 11,909 | 12,219 | 11,354 | 11,037 | 11,927 | 11,779 | 11,227 | 12,777 | 14,614 |
| 2022 | 12,469 | 10,718 | 11,233 | 11,536 | 14,375 | 13,721 | 14,051 | 14,216 | 13,775 | 12,760 | 15,128 | 14,408 |
| 2023 | 12,707 | 12,171 | 14,693 | 13,347 | 12,112 | 12,700 | 13,751 | 11,946 | 13,285 | 12,668 | 13,686 | 17,070 |
| 2024 | 14,836 | 10,683 | 11,980 | 12,551 | 11,647 | 14,115 | ||||||
| - = No Data Reported; -- = Not Applicable; NA = Not Available; W = Withheld to avoid disclosure of individual company data. |
| Release Date: 8/30/2024 |
| Next Release Date: 9/30/2024 |