|
Download Data (XLS File) |
|
||||||||
|
||||||||
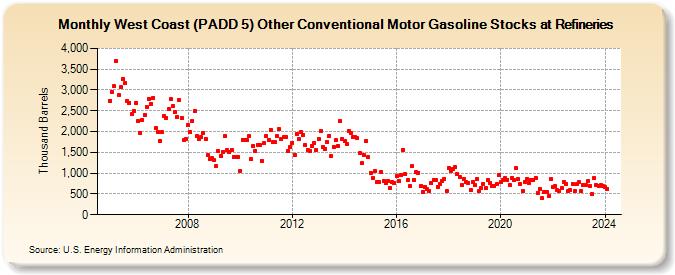
| West Coast (PADD 5) Other Conventional Motor Gasoline Stocks at Refineries (Thousand Barrels) | ||||||||
| Year | Jan | Feb | Mar | Apr | May | Jun | Jul | Aug | Sep | Oct | Nov | Dec |
|---|---|---|---|---|---|---|---|---|---|---|---|---|
| 2005 | 2,743 | 2,956 | 3,085 | 3,700 | 2,876 | 3,063 | 3,267 | 3,171 | 2,733 | 2,698 | 2,419 | 2,494 |
| 2006 | 2,689 | 2,262 | 1,962 | 2,282 | 2,398 | 2,602 | 2,792 | 2,672 | 2,813 | 2,078 | 2,001 | 1,761 |
| 2007 | 1,978 | 2,368 | 2,334 | 2,531 | 2,779 | 2,607 | 2,461 | 2,354 | 2,750 | 2,322 | 1,789 | 1,823 |
| 2008 | 2,159 | 1,983 | 2,251 | 2,496 | 1,902 | 1,826 | 1,861 | 1,965 | 1,825 | 1,427 | 1,340 | 1,361 |
| 2009 | 1,304 | 1,166 | 1,527 | 1,421 | 1,510 | 1,887 | 1,548 | 1,511 | 1,559 | 1,399 | 1,379 | 1,391 |
| 2010 | 1,062 | 1,798 | 1,796 | 1,786 | 1,883 | 1,329 | 1,659 | 1,538 | 1,681 | 1,685 | 1,293 | 1,715 |
| 2011 | 1,895 | 1,792 | 2,048 | 1,750 | 1,744 | 1,892 | 2,060 | 1,812 | 1,868 | 1,876 | 1,523 | 1,633 |
| 2012 | 1,734 | 1,443 | 1,943 | 1,819 | 1,995 | 1,918 | 1,668 | 1,556 | 1,539 | 1,661 | 1,729 | 1,561 |
| 2013 | 1,830 | 2,011 | 1,622 | 1,587 | 1,760 | 1,902 | 1,401 | 1,637 | 1,785 | 1,664 | 2,259 | 1,828 |
| 2014 | 1,769 | 1,706 | 2,014 | 1,968 | 1,867 | 1,858 | 1,839 | 1,475 | 1,236 | 1,432 | 1,769 | 1,391 |
| 2015 | 1,013 | 872 | 1,046 | 793 | 784 | 1,027 | 813 | 761 | 820 | 644 | 786 | 767 |
| 2016 | 926 | 801 | 946 | 1,556 | 970 | 833 | 689 | 1,164 | 844 | 1,017 | 1,006 | 684 |
| 2017 | 542 | 672 | 609 | 582 | 754 | 840 | 837 | 675 | 738 | 817 | 860 | 559 |
| 2018 | 1,124 | 1,055 | 1,109 | 1,144 | 974 | 896 | 713 | 860 | 780 | 759 | 585 | 787 |
| 2019 | 708 | 856 | 564 | 632 | 747 | 636 | 839 | 766 | 697 | 689 | 743 | 962 |
| 2020 | 775 | 845 | 880 | 845 | 709 | 886 | 827 | 1,113 | 856 | 730 | 576 | 787 |
| 2021 | 868 | 758 | 846 | 825 | 891 | 529 | 628 | 399 | 556 | 552 | 449 | 862 |
| 2022 | 672 | 683 | 589 | 564 | 642 | 785 | 747 | 567 | 591 | 748 | 575 | 728 |
| 2023 | 779 | 562 | 719 | 720 | 808 | 699 | 494 | 881 | 711 | 694 | 709 | 697 |
| 2024 | 664 | |||||||||||
| - = No Data Reported; -- = Not Applicable; NA = Not Available; W = Withheld to avoid disclosure of individual company data. |
| Release Date: 3/29/2024 |
| Next Release Date: 4/30/2024 |