|
Download Data (XLS File) |
|
||||||||
|
||||||||
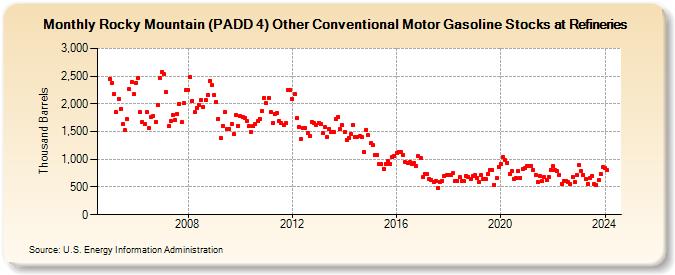
| Rocky Mountain (PADD 4) Other Conventional Motor Gasoline Stocks at Refineries (Thousand Barrels) | ||||||||
| Year | Jan | Feb | Mar | Apr | May | Jun | Jul | Aug | Sep | Oct | Nov | Dec |
|---|---|---|---|---|---|---|---|---|---|---|---|---|
| 2005 | 2,454 | 2,384 | 2,176 | 1,845 | 2,096 | 1,915 | 1,637 | 1,521 | 1,726 | 2,261 | 2,401 | 2,177 |
| 2006 | 2,383 | 2,463 | 1,845 | 1,671 | 1,629 | 1,854 | 1,556 | 1,765 | 1,783 | 1,668 | 1,986 | 2,471 |
| 2007 | 2,579 | 2,532 | 2,212 | 1,592 | 1,688 | 1,796 | 1,716 | 1,817 | 2,002 | 1,664 | 2,009 | 2,246 |
| 2008 | 2,258 | 2,486 | 2,055 | 1,847 | 1,930 | 1,979 | 2,068 | 1,941 | 2,061 | 2,152 | 2,414 | 2,339 |
| 2009 | 2,160 | 2,036 | 1,732 | 1,379 | 1,606 | 1,849 | 1,553 | 1,550 | 1,639 | 1,455 | 1,798 | 1,606 |
| 2010 | 1,774 | 1,757 | 1,753 | 1,696 | 1,596 | 1,488 | 1,600 | 1,639 | 1,685 | 1,729 | 1,869 | 2,109 |
| 2011 | 2,006 | 2,102 | 1,855 | 1,656 | 1,823 | 1,837 | 1,691 | 1,650 | 1,626 | 1,646 | 2,257 | 2,251 |
| 2012 | 2,087 | 2,170 | 1,748 | 1,584 | 1,371 | 1,561 | 1,567 | 1,478 | 1,427 | 1,680 | 1,650 | 1,625 |
| 2013 | 1,659 | 1,640 | 1,478 | 1,575 | 1,401 | 1,546 | 1,493 | 1,489 | 1,720 | 1,760 | 1,541 | 1,615 |
| 2014 | 1,489 | 1,354 | 1,387 | 1,454 | 1,614 | 1,406 | 1,402 | 1,413 | 1,397 | 1,132 | 1,534 | 1,430 |
| 2015 | 1,288 | 1,250 | 1,076 | 1,081 | 920 | 907 | 832 | 918 | 970 | 917 | 1,040 | 1,066 |
| 2016 | 1,115 | 1,133 | 1,131 | 1,078 | 944 | 926 | 943 | 920 | 938 | 883 | 1,057 | 1,015 |
| 2017 | 675 | 740 | 730 | 640 | 625 | 594 | 611 | 484 | 596 | 616 | 691 | 712 |
| 2018 | 711 | 723 | 745 | 613 | 609 | 672 | 601 | 602 | 702 | 687 | 649 | 696 |
| 2019 | 713 | 665 | 597 | 710 | 649 | 648 | 730 | 807 | 804 | 544 | 659 | 865 |
| 2020 | 921 | 1,032 | 983 | 939 | 738 | 783 | 649 | 665 | 784 | 669 | 818 | 835 |
| 2021 | 886 | 887 | 887 | 810 | 721 | 597 | 692 | 601 | 673 | 623 | 686 | 813 |
| 2022 | 874 | 800 | 785 | 721 | 559 | 603 | 607 | 585 | 550 | 677 | 592 | 720 |
| 2023 | 895 | 787 | 719 | 641 | 556 | 665 | 702 | 552 | 532 | 618 | 743 | 855 |
| 2024 | 842 | |||||||||||
| - = No Data Reported; -- = Not Applicable; NA = Not Available; W = Withheld to avoid disclosure of individual company data. |
| Release Date: 3/29/2024 |
| Next Release Date: 4/30/2024 |