|
Download Data (XLS File) |
|
||||||||
|
||||||||
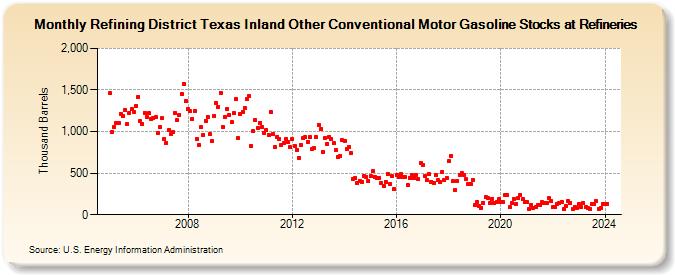
| Refining District Texas Inland Other Conventional Motor Gasoline Stocks at Refineries (Thousand Barrels) | ||||||||
| Year | Jan | Feb | Mar | Apr | May | Jun | Jul | Aug | Sep | Oct | Nov | Dec |
|---|---|---|---|---|---|---|---|---|---|---|---|---|
| 2005 | 1,460 | 994 | 1,057 | 1,105 | 1,101 | 1,213 | 1,184 | 1,256 | 1,088 | 1,227 | 1,269 | 1,239 |
| 2006 | 1,312 | 1,421 | 1,121 | 1,096 | 1,228 | 1,176 | 1,218 | 1,150 | 1,161 | 1,172 | 980 | 1,049 |
| 2007 | 1,157 | 912 | 862 | 1,015 | 968 | 991 | 1,229 | 1,135 | 1,202 | 1,457 | 1,575 | 1,369 |
| 2008 | 1,274 | 1,243 | 1,151 | 1,252 | 915 | 833 | 1,049 | 964 | 1,130 | 1,177 | 968 | 887 |
| 2009 | 1,187 | 1,339 | 1,299 | 1,467 | 1,060 | 1,179 | 1,274 | 1,201 | 1,110 | 1,219 | 1,390 | 922 |
| 2010 | 1,208 | 1,240 | 1,284 | 1,391 | 1,424 | 825 | 1,008 | 1,136 | 1,043 | 1,107 | 1,053 | 986 |
| 2011 | 1,017 | 964 | 1,236 | 967 | 814 | 937 | 911 | 841 | 858 | 908 | 870 | 813 |
| 2012 | 912 | 827 | 780 | 687 | 844 | 918 | 937 | 877 | 940 | 794 | 798 | 930 |
| 2013 | 1,083 | 1,032 | 755 | 924 | 854 | 939 | 913 | 861 | 781 | 692 | 711 | 901 |
| 2014 | 891 | 791 | 813 | 738 | 430 | 442 | 377 | 407 | 397 | 470 | 457 | 405 |
| 2015 | 464 | 522 | 457 | 438 | 443 | 380 | 345 | 398 | 493 | 375 | 463 | 307 |
| 2016 | 475 | 459 | 486 | 449 | 453 | 359 | 446 | 475 | 438 | 476 | 429 | 623 |
| 2017 | 603 | 464 | 412 | 484 | 397 | 382 | 475 | 414 | 391 | 511 | 421 | 443 |
| 2018 | 645 | 712 | 400 | 301 | 403 | 483 | 497 | 483 | 430 | 368 | 365 | 422 |
| 2019 | 118 | 157 | 109 | 85 | 141 | 209 | 203 | 144 | 193 | 138 | 153 | 184 |
| 2020 | 151 | 150 | 233 | 233 | 90 | 143 | 189 | 133 | 199 | 241 | 188 | 151 |
| 2021 | 147 | 64 | 119 | 80 | 87 | 114 | 115 | 148 | 145 | 140 | 196 | 168 |
| 2022 | 89 | 89 | 130 | 140 | 158 | 68 | 108 | 162 | 143 | 68 | 93 | 77 |
| 2023 | 131 | 87 | 138 | 91 | 84 | 70 | 127 | 130 | 166 | 70 | 81 | 134 |
| 2024 | 132 | 129 | 146 | 94 | 84 | 50 | ||||||
| - = No Data Reported; -- = Not Applicable; NA = Not Available; W = Withheld to avoid disclosure of individual company data. |
| Release Date: 8/30/2024 |
| Next Release Date: 9/30/2024 |