|
Download Data (XLS File) |
|
||||||||
|
||||||||
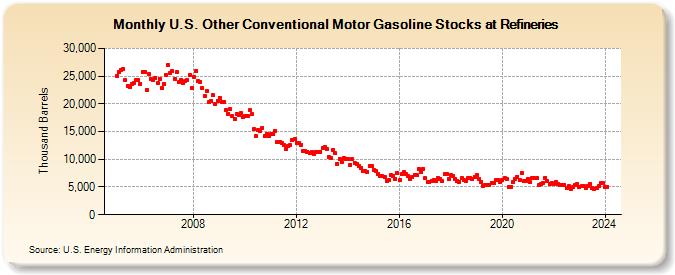
| U.S. Other Conventional Motor Gasoline Stocks at Refineries (Thousand Barrels) | ||||||||
| Year | Jan | Feb | Mar | Apr | May | Jun | Jul | Aug | Sep | Oct | Nov | Dec |
|---|---|---|---|---|---|---|---|---|---|---|---|---|
| 2005 | 25,083 | 25,684 | 26,114 | 26,221 | 24,214 | 23,283 | 23,060 | 23,622 | 23,782 | 24,227 | 24,332 | 23,601 |
| 2006 | 25,824 | 25,747 | 22,533 | 25,311 | 24,389 | 24,362 | 24,689 | 23,700 | 24,551 | 22,789 | 23,661 | 25,280 |
| 2007 | 27,020 | 25,507 | 25,900 | 24,446 | 25,733 | 23,863 | 24,339 | 23,721 | 24,133 | 24,294 | 25,157 | 22,892 |
| 2008 | 24,887 | 25,934 | 24,076 | 23,944 | 22,845 | 21,438 | 22,323 | 20,250 | 20,472 | 21,509 | 19,964 | 20,562 |
| 2009 | 21,099 | 20,288 | 20,409 | 18,871 | 18,247 | 19,029 | 17,801 | 17,221 | 18,181 | 17,993 | 18,288 | 17,571 |
| 2010 | 17,826 | 17,806 | 18,808 | 18,204 | 15,413 | 14,126 | 15,311 | 15,092 | 15,688 | 14,156 | 14,589 | 14,181 |
| 2011 | 14,513 | 14,493 | 15,111 | 13,060 | 13,193 | 12,950 | 12,610 | 11,838 | 12,476 | 12,578 | 13,447 | 13,604 |
| 2012 | 12,947 | 12,893 | 12,632 | 11,505 | 11,441 | 11,349 | 11,182 | 11,383 | 10,947 | 11,293 | 11,347 | 11,401 |
| 2013 | 12,009 | 12,230 | 11,782 | 10,453 | 10,229 | 11,722 | 11,115 | 9,113 | 10,054 | 9,483 | 10,187 | 10,068 |
| 2014 | 10,007 | 9,037 | 10,015 | 9,310 | 9,187 | 8,725 | 8,432 | 7,840 | 7,875 | 7,757 | 8,833 | 8,712 |
| 2015 | 8,127 | 7,801 | 7,382 | 7,024 | 6,938 | 6,824 | 6,155 | 6,250 | 7,088 | 7,063 | 6,513 | 7,498 |
| 2016 | 6,305 | 7,263 | 7,634 | 7,361 | 6,929 | 6,408 | 6,787 | 7,239 | 7,086 | 8,309 | 7,738 | 8,282 |
| 2017 | 6,544 | 5,870 | 5,822 | 6,141 | 6,302 | 6,161 | 6,641 | 6,483 | 6,043 | 7,268 | 7,396 | 6,524 |
| 2018 | 7,112 | 6,977 | 6,432 | 6,129 | 5,985 | 6,547 | 6,259 | 6,106 | 6,558 | 6,653 | 6,394 | 6,815 |
| 2019 | 7,140 | 6,488 | 5,944 | 5,193 | 5,385 | 5,443 | 5,407 | 5,767 | 5,676 | 6,233 | 6,215 | 5,921 |
| 2020 | 6,177 | 6,551 | 6,392 | 4,981 | 5,085 | 5,870 | 6,510 | 6,886 | 6,180 | 7,484 | 6,022 | 6,098 |
| 2021 | 6,468 | 5,828 | 6,579 | 6,539 | 6,545 | 5,295 | 5,524 | 5,768 | 6,667 | 6,082 | 5,481 | 5,664 |
| 2022 | 5,614 | 5,953 | 5,570 | 5,357 | 5,365 | 5,408 | 4,793 | 5,138 | 4,634 | 4,950 | 5,313 | 5,515 |
| 2023 | 5,006 | 5,151 | 5,096 | 4,735 | 5,199 | 5,621 | 4,805 | 4,616 | 4,907 | 5,211 | 5,804 | 5,644 |
| 2024 | 5,075 | |||||||||||
| - = No Data Reported; -- = Not Applicable; NA = Not Available; W = Withheld to avoid disclosure of individual company data. |
| Release Date: 3/29/2024 |
| Next Release Date: 4/30/2024 |