|
Download Data (XLS File) |
|
||||||||
|
||||||||
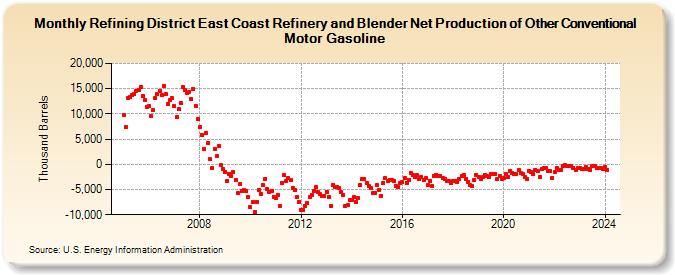
| Refining District East Coast Refinery and Blender Net Production of Other Conventional Motor Gasoline (Thousand Barrels) | ||||||||
| Year | Jan | Feb | Mar | Apr | May | Jun | Jul | Aug | Sep | Oct | Nov | Dec |
|---|---|---|---|---|---|---|---|---|---|---|---|---|
| 2005 | 9,720 | 7,427 | 13,160 | 13,280 | 13,752 | 13,881 | 14,568 | 14,780 | 15,348 | 13,471 | 12,666 | 11,443 |
| 2006 | 11,548 | 9,513 | 10,745 | 13,233 | 13,876 | 14,631 | 13,706 | 15,586 | 13,868 | 11,875 | 12,735 | 13,068 |
| 2007 | 11,479 | 9,311 | 10,900 | 12,128 | 15,349 | 14,737 | 14,148 | 14,425 | 12,942 | 14,889 | 11,640 | 8,911 |
| 2008 | 7,397 | 5,909 | 2,998 | 6,220 | 4,216 | 962 | -722 | 3,034 | 1,665 | 3,696 | -184 | -877 |
| 2009 | -1,499 | -3,328 | -1,862 | -2,281 | -1,553 | -3,137 | -5,693 | -3,919 | -5,295 | -5,076 | -5,383 | -6,466 |
| 2010 | -8,421 | -7,437 | -9,516 | -7,390 | -5,170 | -5,820 | -4,037 | -2,894 | -4,865 | -5,518 | -5,371 | -6,387 |
| 2011 | -6,646 | -6,098 | -8,255 | -3,648 | -2,207 | -3,270 | -2,696 | -3,159 | -4,660 | -5,133 | -6,452 | -7,391 |
| 2012 | -9,035 | -9,111 | -8,193 | -7,610 | -6,439 | -6,076 | -5,201 | -4,560 | -5,500 | -5,972 | -6,260 | -6,192 |
| 2013 | -5,474 | -6,437 | -8,183 | -4,102 | -4,526 | -4,578 | -4,654 | -5,447 | -6,061 | -8,350 | -8,040 | -7,074 |
| 2014 | -7,175 | -6,505 | -7,490 | -6,679 | -4,151 | -2,834 | -2,842 | -3,757 | -4,379 | -4,683 | -5,596 | -5,705 |
| 2015 | -4,184 | -5,040 | -6,310 | -3,748 | -2,813 | -3,267 | -3,072 | -3,053 | -3,256 | -4,296 | -4,527 | -3,717 |
| 2016 | -3,550 | -2,653 | -3,626 | -3,025 | -1,761 | -2,084 | -2,598 | -2,221 | -2,955 | -2,582 | -3,105 | -2,796 |
| 2017 | -4,153 | -3,255 | -4,268 | -2,366 | -2,040 | -2,364 | -2,244 | -2,696 | -2,905 | -3,306 | -3,291 | -3,807 |
| 2018 | -3,359 | -3,278 | -3,489 | -3,006 | -2,226 | -2,113 | -2,822 | -3,474 | -4,158 | -4,286 | -3,128 | -2,157 |
| 2019 | -2,456 | -2,947 | -2,592 | -2,166 | -2,383 | -2,509 | -1,831 | -1,965 | -2,015 | -2,987 | -2,255 | -2,927 |
| 2020 | -2,773 | -1,875 | -2,501 | -1,236 | -1,766 | -1,859 | -1,942 | -1,159 | -1,803 | -1,854 | -2,581 | -2,904 |
| 2021 | -1,324 | -1,576 | -1,925 | -1,102 | -1,307 | -2,422 | -1,025 | -768 | -769 | -1,268 | -1,310 | -2,642 |
| 2022 | -1,567 | -743 | -1,083 | -1,067 | -353 | -217 | -272 | -329 | -391 | -721 | -1,068 | -717 |
| 2023 | -732 | -950 | -858 | -529 | -847 | -1,096 | -398 | -335 | -725 | -784 | -741 | -955 |
| 2024 | -500 | |||||||||||
| - = No Data Reported; -- = Not Applicable; NA = Not Available; W = Withheld to avoid disclosure of individual company data. |
| Release Date: 3/29/2024 |
| Next Release Date: 4/30/2024 |