|
Download Data (XLS File) |
|
||||||||
|
||||||||
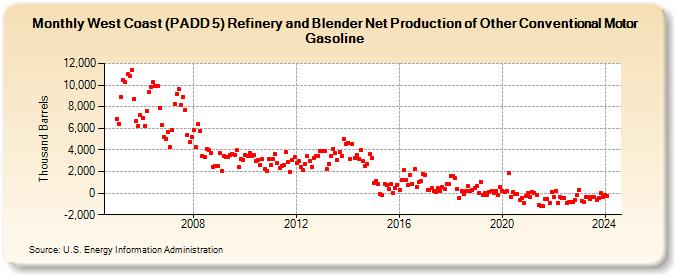
| West Coast (PADD 5) Refinery and Blender Net Production of Other Conventional Motor Gasoline (Thousand Barrels) | ||||||||
| Year | Jan | Feb | Mar | Apr | May | Jun | Jul | Aug | Sep | Oct | Nov | Dec |
|---|---|---|---|---|---|---|---|---|---|---|---|---|
| 2005 | 6,865 | 6,380 | 8,940 | 10,453 | 10,243 | 10,981 | 10,862 | 11,382 | 8,667 | 6,665 | 6,238 | 7,197 |
| 2006 | 6,920 | 6,204 | 7,558 | 9,379 | 9,796 | 10,294 | 9,876 | 9,892 | 7,894 | 6,302 | 5,198 | 5,048 |
| 2007 | 5,647 | 4,224 | 5,798 | 8,285 | 9,142 | 9,615 | 8,199 | 8,898 | 7,687 | 5,351 | 4,686 | 5,198 |
| 2008 | 5,821 | 4,307 | 6,352 | 5,709 | 3,397 | 3,342 | 4,074 | 4,019 | 3,717 | 2,407 | 2,502 | 2,478 |
| 2009 | 3,690 | 2,074 | 3,412 | 3,369 | 3,325 | 3,508 | 3,602 | 3,507 | 3,956 | 2,414 | 3,174 | 3,099 |
| 2010 | 3,531 | 3,427 | 3,739 | 3,407 | 3,497 | 2,949 | 3,035 | 2,641 | 3,152 | 2,230 | 2,079 | 3,193 |
| 2011 | 2,604 | 3,203 | 3,592 | 2,803 | 2,334 | 2,549 | 2,615 | 3,782 | 2,834 | 1,935 | 3,026 | 3,351 |
| 2012 | 2,769 | 2,971 | 2,437 | 2,114 | 2,706 | 3,437 | 3,012 | 2,444 | 3,270 | 3,466 | 3,430 | 3,859 |
| 2013 | 3,944 | 3,865 | 2,216 | 2,716 | 3,478 | 4,121 | 3,682 | 3,080 | 3,763 | 3,431 | 4,993 | 4,502 |
| 2014 | 4,661 | 3,180 | 4,569 | 3,272 | 3,549 | 3,192 | 3,950 | 2,931 | 2,516 | 2,668 | 3,612 | 3,231 |
| 2015 | 926 | 1,115 | 823 | -125 | -191 | 853 | 745 | 410 | 829 | 11 | 484 | 758 |
| 2016 | 308 | 1,209 | 2,145 | 1,228 | 758 | 1,679 | 817 | 2,193 | 548 | 1,057 | 1,081 | 1,776 |
| 2017 | 1,681 | 321 | 246 | 443 | 184 | 148 | 439 | 201 | 532 | 419 | 827 | 806 |
| 2018 | 1,616 | 1,572 | 1,364 | 345 | -446 | 175 | -76 | 169 | 636 | 167 | 298 | 499 |
| 2019 | 675 | 49 | 1,038 | -189 | 37 | -148 | 132 | 182 | 23 | 161 | -218 | 567 |
| 2020 | 230 | 96 | 216 | 1,825 | -333 | 67 | -124 | -47 | -672 | -438 | -892 | -310 |
| 2021 | 1 | -341 | 128 | -10 | -173 | -1,123 | -1,178 | -1,199 | -572 | -543 | -874 | 88 |
| 2022 | -317 | 221 | -873 | -405 | -432 | -470 | -886 | -840 | -813 | -777 | -638 | -216 |
| 2023 | 315 | -703 | -786 | -370 | -330 | -510 | -329 | -379 | -636 | -488 | -3 | -374 |
| 2024 | -132 | |||||||||||
| - = No Data Reported; -- = Not Applicable; NA = Not Available; W = Withheld to avoid disclosure of individual company data. |
| Release Date: 3/29/2024 |
| Next Release Date: 4/30/2024 |