|
Download Data (XLS File) |
|
||||||||
|
||||||||
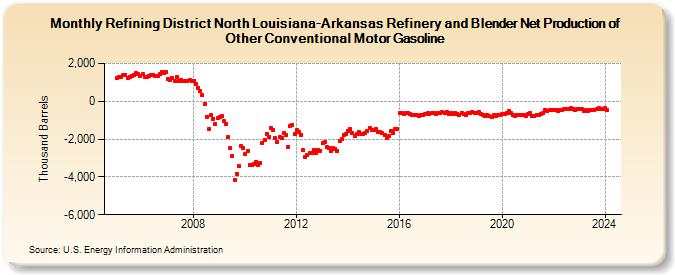
| Refining District North Louisiana-Arkansas Refinery and Blender Net Production of Other Conventional Motor Gasoline (Thousand Barrels) | ||||||||
| Year | Jan | Feb | Mar | Apr | May | Jun | Jul | Aug | Sep | Oct | Nov | Dec |
|---|---|---|---|---|---|---|---|---|---|---|---|---|
| 2005 | 1,250 | 1,279 | 1,289 | 1,367 | 1,402 | 1,236 | 1,293 | 1,336 | 1,387 | 1,479 | 1,419 | 1,327 |
| 2006 | 1,430 | 1,275 | 1,272 | 1,343 | 1,390 | 1,397 | 1,346 | 1,324 | 1,433 | 1,551 | 1,482 | 1,539 |
| 2007 | 1,199 | 1,112 | 1,233 | 1,058 | 1,296 | 1,095 | 1,148 | 1,088 | 1,070 | 1,097 | 1,125 | 1,099 |
| 2008 | 1,088 | 896 | 720 | 554 | 344 | -162 | -827 | -1,464 | -732 | -920 | -1,207 | -881 |
| 2009 | -825 | -786 | -1,028 | -1,187 | -1,892 | -2,476 | -2,898 | -4,150 | -3,830 | -3,426 | -2,357 | -2,469 |
| 2010 | -2,797 | -2,654 | -3,396 | -3,362 | -3,322 | -3,189 | -3,362 | -3,244 | -2,204 | -2,041 | -1,728 | -1,875 |
| 2011 | -1,399 | -1,537 | -1,956 | -2,160 | -1,909 | -1,919 | -1,694 | -1,783 | -2,397 | -1,282 | -1,234 | -1,734 |
| 2012 | -1,530 | -1,641 | -1,764 | -2,601 | -2,950 | -2,829 | -2,755 | -2,747 | -2,560 | -2,748 | -2,559 | -2,605 |
| 2013 | -2,216 | -2,158 | -2,427 | -2,448 | -2,640 | -2,469 | -2,514 | -2,647 | -2,109 | -1,995 | -1,800 | -1,722 |
| 2014 | -1,548 | -1,478 | -1,685 | -1,815 | -1,724 | -1,623 | -1,706 | -1,727 | -1,661 | -1,564 | -1,424 | -1,525 |
| 2015 | -1,507 | -1,477 | -1,646 | -1,645 | -1,694 | -1,801 | -1,952 | -1,839 | -1,562 | -1,667 | -1,488 | -1,492 |
| 2016 | -624 | -640 | -696 | -642 | -639 | -648 | -712 | -745 | -739 | -752 | -710 | -712 |
| 2017 | -656 | -638 | -657 | -609 | -605 | -663 | -626 | -645 | -585 | -595 | -591 | -676 |
| 2018 | -644 | -659 | -601 | -655 | -725 | -609 | -697 | -715 | -640 | -623 | -541 | -598 |
| 2019 | -639 | -552 | -687 | -711 | -767 | -725 | -786 | -815 | -718 | -779 | -739 | -734 |
| 2020 | -673 | -683 | -624 | -536 | -640 | -718 | -763 | -721 | -749 | -727 | -704 | -772 |
| 2021 | -654 | -614 | -787 | -756 | -720 | -714 | -666 | -594 | -458 | -511 | -459 | -447 |
| 2022 | -452 | -436 | -512 | -461 | -441 | -425 | -394 | -419 | -370 | -401 | -450 | -430 |
| 2023 | -401 | -419 | -504 | -455 | -496 | -453 | -476 | -456 | -422 | -361 | -388 | -415 |
| 2024 | -372 | |||||||||||
| - = No Data Reported; -- = Not Applicable; NA = Not Available; W = Withheld to avoid disclosure of individual company data. |
| Release Date: 3/29/2024 |
| Next Release Date: 4/30/2024 |