|
Download Data (XLS File) |
|
||||||||
|
||||||||
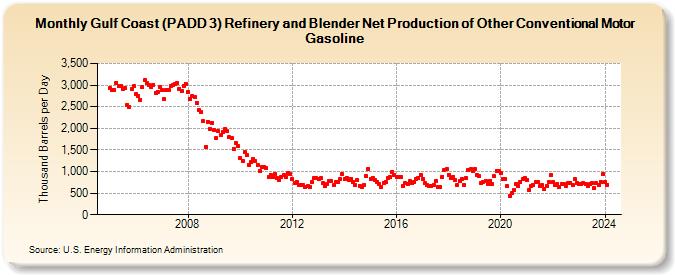
| Gulf Coast (PADD 3) Refinery and Blender Net Production of Other Conventional Motor Gasoline (Thousand Barrels per Day) | ||||||||
| Year | Jan | Feb | Mar | Apr | May | Jun | Jul | Aug | Sep | Oct | Nov | Dec |
|---|---|---|---|---|---|---|---|---|---|---|---|---|
| 2005 | 2,932 | 2,883 | 2,894 | 3,055 | 2,985 | 2,985 | 2,920 | 2,935 | 2,543 | 2,502 | 2,915 | 2,971 |
| 2006 | 2,790 | 2,744 | 2,659 | 2,955 | 3,107 | 3,044 | 3,005 | 2,959 | 3,008 | 2,821 | 2,851 | 2,955 |
| 2007 | 2,887 | 2,679 | 2,875 | 2,878 | 2,983 | 3,006 | 3,031 | 3,052 | 2,919 | 2,856 | 2,975 | 3,034 |
| 2008 | 2,850 | 2,685 | 2,752 | 2,729 | 2,589 | 2,417 | 2,373 | 2,159 | 1,574 | 2,152 | 1,994 | 2,125 |
| 2009 | 1,949 | 1,764 | 1,932 | 1,837 | 1,914 | 1,986 | 1,927 | 1,788 | 1,785 | 1,523 | 1,668 | 1,588 |
| 2010 | 1,308 | 1,244 | 1,443 | 1,373 | 1,162 | 1,215 | 1,292 | 1,246 | 1,160 | 1,012 | 1,102 | 1,115 |
| 2011 | 1,076 | 869 | 926 | 873 | 950 | 855 | 793 | 864 | 914 | 880 | 957 | 934 |
| 2012 | 826 | 736 | 761 | 690 | 699 | 685 | 649 | 666 | 649 | 757 | 851 | 841 |
| 2013 | 835 | 845 | 725 | 653 | 716 | 784 | 772 | 678 | 756 | 768 | 828 | 935 |
| 2014 | 820 | 861 | 792 | 834 | 766 | 685 | 809 | 673 | 648 | 689 | 893 | 1,059 |
| 2015 | 833 | 858 | 796 | 759 | 710 | 647 | 740 | 768 | 839 | 878 | 991 | 916 |
| 2016 | 877 | 870 | 873 | 672 | 734 | 702 | 770 | 736 | 757 | 834 | 843 | 920 |
| 2017 | 829 | 727 | 682 | 666 | 665 | 688 | 781 | 650 | 637 | 884 | 1,040 | 1,057 |
| 2018 | 924 | 839 | 882 | 813 | 690 | 781 | 826 | 691 | 849 | 1,028 | 1,050 | 1,003 |
| 2019 | 1,056 | 928 | 889 | 725 | 768 | 780 | 714 | 787 | 710 | 887 | 1,015 | 1,003 |
| 2020 | 954 | 826 | 820 | 655 | 437 | 502 | 562 | 706 | 666 | 746 | 827 | 847 |
| 2021 | 810 | 579 | 659 | 692 | 748 | 760 | 658 | 678 | 604 | 670 | 766 | 916 |
| 2022 | 748 | 681 | 713 | 640 | 707 | 709 | 669 | 734 | 741 | 683 | 816 | 741 |
| 2023 | 714 | 704 | 732 | 703 | 668 | 710 | 726 | 622 | 725 | 682 | 768 | 942 |
| 2024 | 755 | |||||||||||
| - = No Data Reported; -- = Not Applicable; NA = Not Available; W = Withheld to avoid disclosure of individual company data. |
| Release Date: 3/29/2024 |
| Next Release Date: 4/30/2024 |