|
Download Data (XLS File) |
|
||||||||
|
||||||||
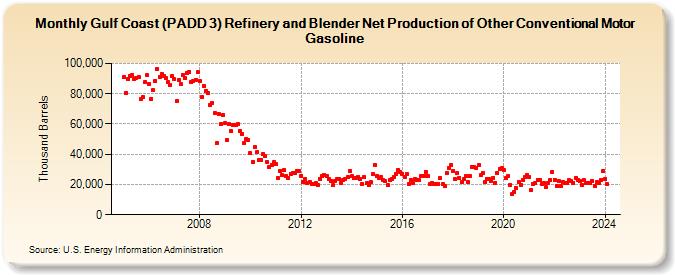
| Gulf Coast (PADD 3) Refinery and Blender Net Production of Other Conventional Motor Gasoline (Thousand Barrels) | ||||||||
| Year | Jan | Feb | Mar | Apr | May | Jun | Jul | Aug | Sep | Oct | Nov | Dec |
|---|---|---|---|---|---|---|---|---|---|---|---|---|
| 2005 | 90,902 | 80,731 | 89,723 | 91,654 | 92,522 | 89,557 | 90,508 | 90,999 | 76,299 | 77,573 | 87,464 | 92,116 |
| 2006 | 86,505 | 76,837 | 82,437 | 88,645 | 96,329 | 91,311 | 93,141 | 91,737 | 90,225 | 87,459 | 85,539 | 91,601 |
| 2007 | 89,508 | 75,019 | 89,127 | 86,347 | 92,482 | 90,178 | 93,974 | 94,606 | 87,568 | 88,547 | 89,245 | 94,043 |
| 2008 | 88,342 | 77,872 | 85,311 | 81,856 | 80,268 | 72,523 | 73,565 | 66,929 | 47,228 | 66,722 | 59,813 | 65,871 |
| 2009 | 60,407 | 49,384 | 59,879 | 55,108 | 59,342 | 59,565 | 59,730 | 55,434 | 53,547 | 47,202 | 50,050 | 49,242 |
| 2010 | 40,543 | 34,843 | 44,730 | 41,176 | 36,015 | 36,437 | 40,057 | 38,638 | 34,786 | 31,384 | 33,056 | 34,575 |
| 2011 | 33,367 | 24,345 | 28,700 | 26,200 | 29,435 | 25,653 | 24,578 | 26,785 | 27,406 | 27,295 | 28,723 | 28,955 |
| 2012 | 25,602 | 21,352 | 23,577 | 20,710 | 21,669 | 20,564 | 20,113 | 20,651 | 19,481 | 23,473 | 25,539 | 26,085 |
| 2013 | 25,878 | 23,658 | 22,469 | 19,603 | 22,190 | 23,533 | 23,938 | 21,005 | 22,675 | 23,820 | 24,834 | 28,996 |
| 2014 | 25,412 | 24,098 | 24,560 | 25,021 | 23,731 | 20,544 | 25,070 | 20,852 | 19,432 | 21,360 | 26,799 | 32,833 |
| 2015 | 25,808 | 24,027 | 24,685 | 22,769 | 22,019 | 19,411 | 22,955 | 23,815 | 25,162 | 27,221 | 29,724 | 28,384 |
| 2016 | 27,199 | 25,239 | 27,054 | 20,173 | 22,768 | 21,067 | 23,859 | 22,822 | 22,695 | 25,866 | 25,289 | 28,513 |
| 2017 | 25,693 | 20,360 | 21,135 | 19,987 | 20,627 | 20,637 | 24,197 | 20,165 | 19,103 | 27,394 | 31,208 | 32,765 |
| 2018 | 28,658 | 23,502 | 27,336 | 24,384 | 21,386 | 23,431 | 25,592 | 21,407 | 25,476 | 31,871 | 31,509 | 31,096 |
| 2019 | 32,726 | 25,977 | 27,574 | 21,736 | 23,815 | 23,403 | 22,128 | 24,395 | 21,293 | 27,501 | 30,440 | 31,105 |
| 2020 | 29,574 | 23,950 | 25,427 | 19,641 | 13,543 | 15,052 | 17,429 | 21,898 | 19,970 | 23,140 | 24,802 | 26,260 |
| 2021 | 25,115 | 16,202 | 20,420 | 20,755 | 23,182 | 22,801 | 20,402 | 21,033 | 18,134 | 20,763 | 22,967 | 28,384 |
| 2022 | 23,177 | 19,070 | 22,101 | 19,193 | 21,932 | 21,255 | 20,753 | 22,762 | 22,223 | 21,164 | 24,493 | 22,965 |
| 2023 | 22,119 | 19,707 | 22,700 | 21,080 | 20,721 | 21,300 | 22,520 | 19,274 | 21,746 | 21,147 | 23,054 | 29,212 |
| 2024 | 23,390 | |||||||||||
| - = No Data Reported; -- = Not Applicable; NA = Not Available; W = Withheld to avoid disclosure of individual company data. |
| Release Date: 3/29/2024 |
| Next Release Date: 4/30/2024 |