|
Download Data (XLS File) |
|
||||||||
|
||||||||
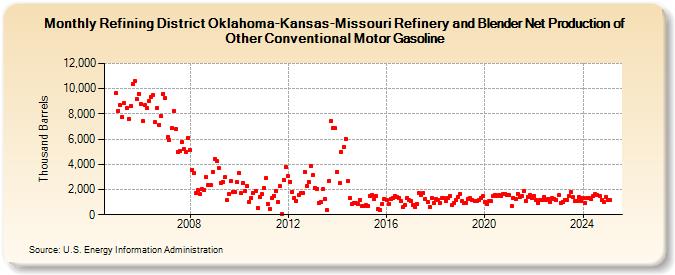
| Refining District Oklahoma-Kansas-Missouri Refinery and Blender Net Production of Other Conventional Motor Gasoline (Thousand Barrels) | ||||||||
| Year | Jan | Feb | Mar | Apr | May | Jun | Jul | Aug | Sep | Oct | Nov | Dec |
|---|---|---|---|---|---|---|---|---|---|---|---|---|
| 2005 | 9,626 | 8,254 | 8,675 | 7,759 | 8,878 | 8,457 | 7,608 | 8,587 | 10,379 | 10,607 | 9,159 | 9,618 |
| 2006 | 8,790 | 7,409 | 8,686 | 8,431 | 9,004 | 9,351 | 9,481 | 7,331 | 8,491 | 7,149 | 7,807 | 9,602 |
| 2007 | 9,237 | 6,177 | 5,930 | 6,845 | 8,242 | 6,819 | 5,006 | 5,021 | 5,771 | 5,212 | 4,983 | 6,111 |
| 2008 | 5,140 | 3,546 | 3,295 | 1,689 | 1,925 | 1,627 | 2,013 | 1,953 | 2,982 | 2,347 | 2,390 | 3,414 |
| 2009 | 4,456 | 4,265 | 3,695 | 2,536 | 2,630 | 2,962 | 1,141 | 1,642 | 2,637 | 1,768 | 1,795 | 2,577 |
| 2010 | 3,306 | 1,687 | 2,497 | 1,921 | 2,277 | 1,034 | 1,353 | 1,729 | 1,915 | 538 | 1,435 | 1,633 |
| 2011 | 2,119 | 2,877 | 851 | 489 | 1,297 | 1,518 | 1,867 | 1,039 | 2,240 | 57 | 2,758 | 3,781 |
| 2012 | 3,038 | 2,609 | 1,826 | 1,354 | 1,061 | 1,587 | 1,727 | 1,742 | 3,411 | 2,292 | 2,625 | 3,897 |
| 2013 | 3,119 | 2,123 | 2,046 | 963 | 1,038 | 2,014 | 1,237 | 353 | 2,699 | 7,435 | 6,904 | 6,856 |
| 2014 | 3,401 | 2,495 | 5,013 | 5,392 | 6,041 | 2,686 | 1,317 | 814 | 949 | 917 | 822 | 1,183 |
| 2015 | 656 | 681 | 757 | 716 | 1,510 | 1,528 | 1,262 | 1,507 | 470 | 385 | 858 | 1,242 |
| 2016 | 1,168 | 829 | 1,247 | 1,311 | 1,485 | 1,432 | 1,352 | 1,068 | 584 | 752 | 1,335 | 1,132 |
| 2017 | 1,075 | 781 | 596 | 848 | 1,739 | 1,556 | 1,726 | 1,260 | 992 | 634 | 1,354 | 936 |
| 2018 | 1,247 | 1,167 | 953 | 1,298 | 1,299 | 1,074 | 1,343 | 1,490 | 775 | 920 | 1,132 | 1,442 |
| 2019 | 1,673 | 1,063 | 910 | 952 | 1,254 | 1,296 | 1,158 | 1,126 | 1,123 | 1,206 | 1,290 | 1,459 |
| 2020 | 1,043 | 835 | 1,064 | 1,060 | 1,456 | 1,587 | 1,480 | 1,580 | 1,468 | 1,681 | 1,653 | 1,563 |
| 2021 | 1,534 | 693 | 1,350 | 1,265 | 1,677 | 1,402 | 1,490 | 1,851 | 1,090 | 1,410 | 1,565 | 1,345 |
| 2022 | 1,486 | 1,160 | 907 | 1,194 | 1,169 | 1,444 | 1,200 | 1,256 | 1,043 | 1,316 | 1,261 | 1,196 |
| 2023 | 1,511 | 931 | 1,021 | 1,200 | 1,195 | 1,468 | 1,831 | 1,382 | 1,060 | 1,121 | 1,384 | 1,112 |
| 2024 | 1,353 | |||||||||||
| - = No Data Reported; -- = Not Applicable; NA = Not Available; W = Withheld to avoid disclosure of individual company data. |
| Release Date: 3/29/2024 |
| Next Release Date: 4/30/2024 |