|
Download Data (XLS File) |
|
||||||||
|
||||||||
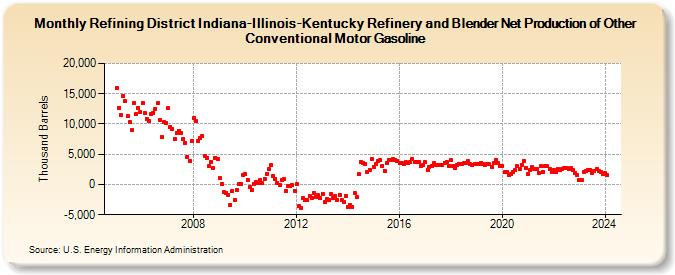
| Refining District Indiana-Illinois-Kentucky Refinery and Blender Net Production of Other Conventional Motor Gasoline (Thousand Barrels) | ||||||||
| Year | Jan | Feb | Mar | Apr | May | Jun | Jul | Aug | Sep | Oct | Nov | Dec |
|---|---|---|---|---|---|---|---|---|---|---|---|---|
| 2005 | 16,001 | 12,692 | 11,542 | 14,668 | 13,721 | 11,370 | 10,320 | 8,933 | 13,447 | 11,662 | 12,708 | 11,950 |
| 2006 | 13,536 | 11,845 | 10,783 | 10,534 | 11,719 | 11,857 | 12,522 | 13,392 | 10,664 | 7,865 | 10,259 | 10,200 |
| 2007 | 12,577 | 9,504 | 9,146 | 7,558 | 8,566 | 8,888 | 8,549 | 7,550 | 6,910 | 4,584 | 3,935 | 7,211 |
| 2008 | 10,957 | 10,532 | 7,255 | 7,727 | 8,091 | 4,636 | 4,430 | 2,987 | 3,746 | 2,657 | 4,443 | 4,139 |
| 2009 | 1,110 | 133 | -1,313 | -1,354 | -1,718 | -3,380 | -1,077 | -2,498 | -893 | 105 | 146 | 1,520 |
| 2010 | 1,654 | 795 | -482 | -920 | 81 | 488 | 209 | 773 | 178 | 964 | 1,793 | 2,556 |
| 2011 | 3,179 | 1,325 | 887 | 233 | -65 | 757 | 959 | -1,063 | -277 | -310 | -169 | -1,038 |
| 2012 | 7 | -3,636 | -3,896 | -2,276 | -2,586 | -2,546 | -1,878 | -2,205 | -1,366 | -2,030 | -1,790 | -2,230 |
| 2013 | -1,517 | -2,878 | -2,356 | -2,577 | -1,592 | -2,177 | -1,968 | -2,502 | -1,688 | -2,629 | -2,845 | -1,872 |
| 2014 | -3,761 | -3,428 | -3,660 | -1,485 | -2,072 | 1,660 | 3,762 | 3,495 | 3,458 | 2,086 | 2,435 | 4,210 |
| 2015 | 2,897 | 3,395 | 3,927 | 3,972 | 3,109 | 2,309 | 3,528 | 4,013 | 4,088 | 4,154 | 4,085 | 3,797 |
| 2016 | 3,477 | 3,476 | 3,399 | 3,640 | 3,611 | 3,670 | 4,189 | 3,640 | 3,705 | 3,727 | 2,986 | 3,296 |
| 2017 | 3,711 | 2,465 | 2,947 | 3,126 | 3,470 | 3,161 | 3,191 | 3,179 | 3,240 | 3,598 | 3,676 | 3,120 |
| 2018 | 3,993 | 3,125 | 2,672 | 3,293 | 3,339 | 3,415 | 3,474 | 3,548 | 3,831 | 3,367 | 3,257 | 3,343 |
| 2019 | 3,417 | 3,308 | 3,529 | 3,364 | 3,244 | 3,303 | 3,379 | 2,883 | 3,560 | 4,068 | 3,491 | 3,084 |
| 2020 | 3,129 | 2,025 | 2,028 | 1,495 | 1,734 | 2,098 | 2,312 | 3,034 | 2,616 | 3,246 | 3,888 | 2,736 |
| 2021 | 1,691 | 2,412 | 2,843 | 2,559 | 2,498 | 1,930 | 2,981 | 2,116 | 3,078 | 2,982 | 2,575 | 2,049 |
| 2022 | 2,434 | 2,063 | 2,541 | 2,384 | 2,501 | 2,685 | 2,741 | 2,556 | 2,689 | 2,362 | 1,936 | 1,487 |
| 2023 | 761 | 661 | 2,071 | 2,225 | 2,412 | 2,351 | 1,908 | 2,197 | 2,527 | 2,225 | 2,113 | 1,754 |
| 2024 | 1,818 | |||||||||||
| - = No Data Reported; -- = Not Applicable; NA = Not Available; W = Withheld to avoid disclosure of individual company data. |
| Release Date: 3/29/2024 |
| Next Release Date: 4/30/2024 |