|
Download Data (XLS File) |
|
||||||||
|
||||||||
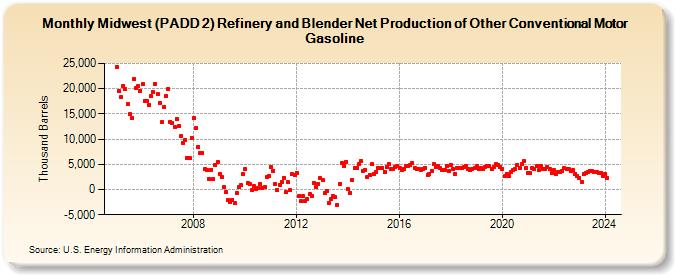
| Midwest (PADD 2) Refinery and Blender Net Production of Other Conventional Motor Gasoline (Thousand Barrels) | ||||||||
| Year | Jan | Feb | Mar | Apr | May | Jun | Jul | Aug | Sep | Oct | Nov | Dec |
|---|---|---|---|---|---|---|---|---|---|---|---|---|
| 2005 | 24,400 | 19,468 | 18,298 | 20,626 | 19,953 | 16,991 | 14,927 | 14,262 | 21,879 | 20,111 | 20,440 | 19,525 |
| 2006 | 20,849 | 17,585 | 17,639 | 16,779 | 18,463 | 19,348 | 20,932 | 18,923 | 17,211 | 13,356 | 16,350 | 18,617 |
| 2007 | 20,019 | 13,475 | 13,190 | 12,336 | 14,030 | 12,567 | 10,670 | 9,301 | 9,852 | 6,196 | 6,243 | 10,297 |
| 2008 | 14,166 | 12,258 | 8,469 | 7,290 | 7,209 | 4,000 | 3,880 | 2,105 | 3,969 | 2,073 | 4,903 | 5,450 |
| 2009 | 3,157 | 2,392 | 420 | -519 | -2,025 | -2,535 | -2,024 | -2,632 | -620 | 539 | 810 | 3,149 |
| 2010 | 3,989 | 1,332 | 1,095 | -89 | 633 | 138 | 250 | 1,064 | 342 | 421 | 2,411 | 2,704 |
| 2011 | 4,500 | 3,722 | 1,066 | -132 | 982 | 1,525 | 2,301 | -590 | 1,421 | -88 | 2,991 | 2,849 |
| 2012 | 3,303 | -1,198 | -2,313 | -1,309 | -2,301 | -1,886 | -962 | -1,255 | 1,346 | 507 | 1,185 | 2,211 |
| 2013 | 1,910 | -735 | -211 | -2,690 | -1,953 | -1,342 | -1,574 | -2,996 | 1,147 | 5,185 | 4,735 | 5,460 |
| 2014 | 20 | -631 | 1,840 | 4,255 | 4,301 | 4,993 | 5,731 | 3,766 | 3,964 | 2,497 | 2,937 | 5,010 |
| 2015 | 3,080 | 3,500 | 4,319 | 4,305 | 4,246 | 3,486 | 4,502 | 5,121 | 4,143 | 4,108 | 4,524 | 4,577 |
| 2016 | 4,242 | 3,934 | 4,132 | 4,627 | 4,744 | 4,789 | 5,240 | 4,339 | 4,045 | 4,142 | 3,929 | 4,155 |
| 2017 | 4,343 | 2,866 | 3,145 | 3,737 | 4,969 | 4,473 | 4,713 | 4,191 | 3,893 | 3,924 | 4,708 | 3,703 |
| 2018 | 4,936 | 4,026 | 3,152 | 4,356 | 4,294 | 4,224 | 4,505 | 4,666 | 4,130 | 3,852 | 4,066 | 4,314 |
| 2019 | 4,646 | 4,049 | 4,231 | 4,008 | 4,391 | 4,648 | 4,633 | 4,065 | 4,416 | 5,047 | 4,832 | 4,563 |
| 2020 | 4,111 | 2,616 | 3,172 | 2,606 | 3,410 | 3,800 | 4,044 | 4,882 | 4,337 | 5,026 | 5,690 | 4,293 |
| 2021 | 3,280 | 3,304 | 4,306 | 4,119 | 4,675 | 3,850 | 4,724 | 4,133 | 4,165 | 4,417 | 4,154 | 3,304 |
| 2022 | 3,846 | 3,154 | 3,391 | 3,551 | 3,666 | 4,168 | 4,006 | 4,014 | 3,747 | 3,796 | 3,163 | 2,648 |
| 2023 | 2,302 | 1,560 | 2,988 | 3,186 | 3,528 | 3,751 | 3,655 | 3,468 | 3,436 | 3,231 | 3,332 | 2,778 |
| 2024 | 3,075 | |||||||||||
| - = No Data Reported; -- = Not Applicable; NA = Not Available; W = Withheld to avoid disclosure of individual company data. |
| Release Date: 3/29/2024 |
| Next Release Date: 4/30/2024 |