|
Download Data (XLS File) |
|
||||||||
|
||||||||
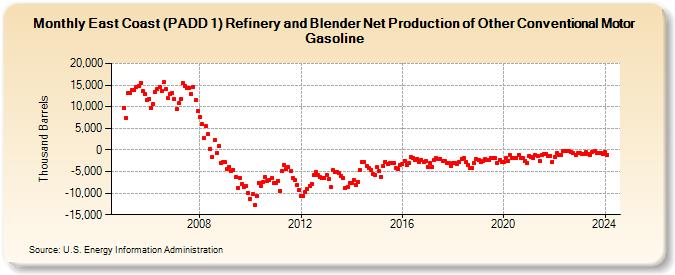
| East Coast (PADD 1) Refinery and Blender Net Production of Other Conventional Motor Gasoline (Thousand Barrels) | ||||||||
| Year | Jan | Feb | Mar | Apr | May | Jun | Jul | Aug | Sep | Oct | Nov | Dec |
|---|---|---|---|---|---|---|---|---|---|---|---|---|
| 2005 | 9,810 | 7,476 | 13,229 | 13,279 | 13,834 | 13,871 | 14,534 | 14,738 | 15,544 | 13,570 | 12,838 | 11,534 |
| 2006 | 11,783 | 9,693 | 10,622 | 13,361 | 14,022 | 14,651 | 13,720 | 15,645 | 14,005 | 11,986 | 12,945 | 13,235 |
| 2007 | 11,728 | 9,377 | 10,778 | 11,776 | 15,399 | 14,861 | 14,243 | 14,370 | 12,962 | 14,586 | 11,582 | 8,952 |
| 2008 | 7,538 | 5,902 | 2,680 | 5,604 | 3,629 | 254 | -1,592 | 2,189 | -611 | 850 | -3,003 | -2,897 |
| 2009 | -2,868 | -4,316 | -3,948 | -4,834 | -4,560 | -6,249 | -8,742 | -6,408 | -7,976 | -8,555 | -8,387 | -9,921 |
| 2010 | -11,337 | -10,320 | -12,846 | -10,709 | -7,597 | -8,450 | -7,317 | -6,259 | -7,275 | -7,041 | -6,595 | -7,601 |
| 2011 | -7,734 | -7,160 | -9,448 | -4,861 | -3,411 | -4,467 | -4,034 | -4,987 | -6,508 | -6,878 | -8,147 | -9,193 |
| 2012 | -10,583 | -10,655 | -9,816 | -8,990 | -8,262 | -7,889 | -5,881 | -5,149 | -5,891 | -6,346 | -6,613 | -6,537 |
| 2013 | -5,851 | -6,812 | -8,599 | -4,747 | -5,191 | -5,098 | -5,333 | -6,046 | -6,564 | -8,791 | -8,484 | -7,566 |
| 2014 | -7,643 | -6,933 | -8,036 | -7,358 | -4,664 | -2,699 | -2,783 | -3,705 | -4,281 | -4,570 | -5,484 | -5,750 |
| 2015 | -4,050 | -4,944 | -6,179 | -3,713 | -2,737 | -3,198 | -2,982 | -2,974 | -3,139 | -4,232 | -4,379 | -3,566 |
| 2016 | -3,333 | -2,463 | -3,432 | -3,011 | -1,581 | -1,848 | -2,351 | -1,993 | -2,726 | -2,323 | -2,853 | -2,554 |
| 2017 | -3,885 | -3,015 | -4,069 | -2,349 | -1,830 | -2,121 | -2,027 | -2,473 | -2,671 | -3,122 | -3,078 | -3,650 |
| 2018 | -3,112 | -3,061 | -3,217 | -2,798 | -1,994 | -1,873 | -2,756 | -3,430 | -4,088 | -4,207 | -3,070 | -2,101 |
| 2019 | -2,401 | -2,886 | -2,531 | -2,137 | -2,344 | -2,443 | -1,784 | -1,931 | -1,947 | -2,943 | -2,226 | -2,885 |
| 2020 | -2,802 | -1,899 | -2,517 | -1,254 | -1,791 | -1,897 | -1,984 | -1,209 | -1,857 | -1,877 | -2,632 | -2,933 |
| 2021 | -1,353 | -1,604 | -1,958 | -1,165 | -1,355 | -2,512 | -1,095 | -869 | -838 | -1,350 | -1,382 | -2,712 |
| 2022 | -1,585 | -757 | -1,083 | -1,067 | -353 | -217 | -287 | -326 | -386 | -713 | -1,083 | -750 |
| 2023 | -728 | -951 | -880 | -545 | -837 | -1,114 | -395 | -355 | -730 | -800 | -753 | -943 |
| 2024 | -512 | |||||||||||
| - = No Data Reported; -- = Not Applicable; NA = Not Available; W = Withheld to avoid disclosure of individual company data. |
| Release Date: 3/29/2024 |
| Next Release Date: 4/30/2024 |