|
Download Data (XLS File) |
|
||||||||
|
||||||||
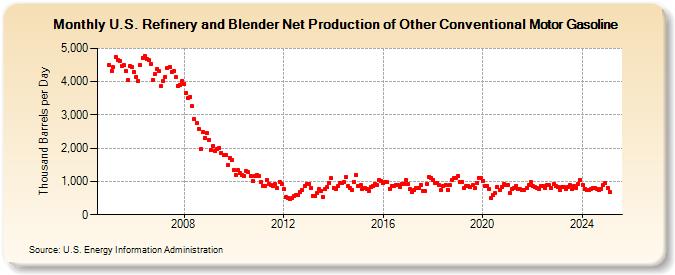
| U.S. Refinery and Blender Net Production of Other Conventional Motor Gasoline (Thousand Barrels per Day) | ||||||||
| Year | Jan | Feb | Mar | Apr | May | Jun | Jul | Aug | Sep | Oct | Nov | Dec |
|---|---|---|---|---|---|---|---|---|---|---|---|---|
| 2005 | 4,495 | 4,324 | 4,431 | 4,748 | 4,647 | 4,628 | 4,469 | 4,490 | 4,326 | 4,042 | 4,462 | 4,435 |
| 2006 | 4,305 | 4,154 | 4,019 | 4,498 | 4,719 | 4,772 | 4,691 | 4,639 | 4,534 | 4,054 | 4,223 | 4,383 |
| 2007 | 4,313 | 3,865 | 4,023 | 4,144 | 4,404 | 4,436 | 4,301 | 4,306 | 4,131 | 3,873 | 3,904 | 4,014 |
| 2008 | 3,941 | 3,660 | 3,515 | 3,540 | 3,254 | 2,870 | 2,764 | 2,585 | 1,961 | 2,496 | 2,316 | 2,463 |
| 2009 | 2,259 | 1,938 | 2,080 | 1,913 | 1,988 | 1,999 | 1,857 | 1,784 | 1,788 | 1,490 | 1,712 | 1,632 |
| 2010 | 1,347 | 1,201 | 1,334 | 1,253 | 1,179 | 1,172 | 1,312 | 1,283 | 1,167 | 1,008 | 1,162 | 1,187 |
| 2011 | 1,168 | 985 | 873 | 865 | 1,054 | 934 | 885 | 864 | 916 | 793 | 991 | 917 |
| 2012 | 768 | 524 | 517 | 477 | 511 | 556 | 603 | 601 | 673 | 741 | 860 | 916 |
| 2013 | 934 | 800 | 567 | 556 | 640 | 761 | 716 | 546 | 769 | 826 | 949 | 1,092 |
| 2014 | 804 | 768 | 852 | 957 | 967 | 970 | 1,131 | 850 | 796 | 755 | 986 | 1,198 |
| 2015 | 876 | 887 | 780 | 802 | 782 | 707 | 827 | 871 | 928 | 895 | 1,037 | 1,008 |
| 2016 | 948 | 982 | 973 | 778 | 876 | 870 | 901 | 894 | 832 | 936 | 932 | 1,039 |
| 2017 | 917 | 758 | 677 | 747 | 795 | 792 | 894 | 721 | 715 | 933 | 1,144 | 1,101 |
| 2018 | 1,057 | 945 | 940 | 882 | 743 | 877 | 890 | 754 | 891 | 1,037 | 1,109 | 1,106 |
| 2019 | 1,167 | 984 | 989 | 790 | 852 | 865 | 831 | 879 | 807 | 960 | 1,116 | 1,095 |
| 2020 | 1,027 | 874 | 871 | 777 | 494 | 584 | 638 | 838 | 741 | 844 | 919 | 897 |
| 2021 | 896 | 652 | 759 | 798 | 872 | 788 | 758 | 749 | 743 | 801 | 891 | 990 |
| 2022 | 866 | 825 | 807 | 760 | 849 | 878 | 809 | 879 | 881 | 809 | 919 | 853 |
| 2023 | 827 | 744 | 819 | 822 | 782 | 845 | 882 | 760 | 860 | 811 | 921 | 1,058 |
| 2024 | 901 | |||||||||||
| - = No Data Reported; -- = Not Applicable; NA = Not Available; W = Withheld to avoid disclosure of individual company data. |
| Release Date: 3/29/2024 |
| Next Release Date: 4/30/2024 |