|
Download Data (XLS File) |
|
||||||||
|
||||||||
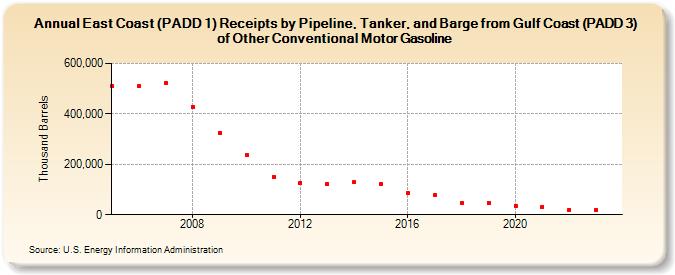
| East Coast (PADD 1) Receipts by Pipeline, Tanker, and Barge from Gulf Coast (PADD 3) of Other Conventional Motor Gasoline (Thousand Barrels) | ||||||||
| Decade | Year-0 | Year-1 | Year-2 | Year-3 | Year-4 | Year-5 | Year-6 | Year-7 | Year-8 | Year-9 |
|---|---|---|---|---|---|---|---|---|---|---|
| 2000's | 509,337 | 509,616 | 523,475 | 429,058 | 325,592 | |||||
| 2010's | 238,765 | 151,070 | 126,922 | 122,451 | 128,664 | 123,367 | 84,783 | 80,145 | 48,043 | 47,747 |
| 2020's | 35,777 | 31,712 | 20,560 | 18,625 |
| - = No Data Reported; -- = Not Applicable; NA = Not Available; W = Withheld to avoid disclosure of individual company data. |
| Release Date: 3/29/2024 |
| Next Release Date: 8/30/2024 |