|
Download Data (XLS File) |
|
||||||||
|
||||||||
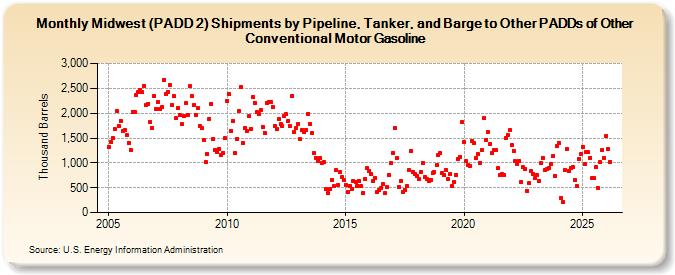
| Midwest (PADD 2) Shipments by Pipeline, Tanker, and Barge to Other PADDs of Other Conventional Motor Gasoline (Thousand Barrels) | ||||||||
| Year | Jan | Feb | Mar | Apr | May | Jun | Jul | Aug | Sep | Oct | Nov | Dec |
|---|---|---|---|---|---|---|---|---|---|---|---|---|
| 2005 | 1,328 | 1,423 | 1,504 | 1,672 | 2,037 | 1,749 | 1,843 | 1,638 | 1,660 | 1,556 | 1,403 | 1,265 |
| 2006 | 2,032 | 2,018 | 2,360 | 2,418 | 2,463 | 2,419 | 2,550 | 2,156 | 2,190 | 1,827 | 1,707 | 2,355 |
| 2007 | 2,088 | 2,233 | 2,089 | 2,120 | 2,675 | 2,390 | 2,432 | 2,568 | 2,167 | 2,337 | 1,901 | 2,107 |
| 2008 | 1,955 | 1,777 | 1,943 | 2,198 | 1,973 | 2,540 | 2,352 | 2,157 | 1,955 | 2,101 | 1,751 | 1,701 |
| 2009 | 1,451 | 1,011 | 1,174 | 1,890 | 2,190 | 1,484 | 1,268 | 1,222 | 1,286 | 1,166 | 1,205 | 1,491 |
| 2010 | 2,249 | 2,385 | 1,651 | 1,841 | 1,193 | 1,490 | 2,042 | 2,528 | 1,402 | 1,700 | 1,651 | 1,937 |
| 2011 | 1,689 | 2,330 | 2,213 | 2,022 | 1,989 | 2,061 | 1,730 | 1,609 | 2,208 | 2,221 | 2,233 | 2,131 |
| 2012 | 1,747 | 1,689 | 1,873 | 1,778 | 1,738 | 1,953 | 1,974 | 1,844 | 1,738 | 2,352 | 1,617 | 1,711 |
| 2013 | 1,790 | 1,471 | 1,664 | 1,614 | 1,663 | 1,989 | 1,786 | 1,597 | 1,196 | 1,105 | 1,046 | 1,090 |
| 2014 | 998 | 1,013 | 473 | 390 | 465 | 650 | 531 | 852 | 554 | 815 | 714 | 658 |
| 2015 | 564 | 420 | 541 | 472 | 639 | 612 | 543 | 628 | 528 | 398 | 678 | 891 |
| 2016 | 841 | 774 | 630 | 704 | 411 | 447 | 501 | 573 | 385 | 510 | 755 | 997 |
| 2017 | 1,205 | 1,696 | 1,098 | 523 | 627 | 419 | 462 | 533 | 853 | 1,242 | 823 | 772 |
| 2018 | 741 | 678 | 824 | 1,005 | 719 | 677 | 640 | 659 | 800 | 818 | 953 | 1,160 |
| 2019 | 1,192 | 793 | 754 | 852 | 668 | 779 | 533 | 625 | 764 | 1,070 | 1,126 | 1,825 |
| 2020 | 1,428 | 1,031 | 965 | 940 | 1,433 | 1,396 | 1,092 | 1,169 | 1,002 | 1,260 | 1,903 | 1,459 |
| 2021 | 1,619 | 1,385 | 1,192 | 1,253 | 1,251 | 889 | 760 | 769 | 755 | 1,503 | 1,563 | 1,653 |
| 2022 | 1,350 | 1,244 | 1,028 | 984 | 1,044 | 623 | 909 | 883 | 430 | 585 | 840 | 776 |
| 2023 | 705 | 759 | 643 | 990 | 1,103 | 852 | 877 | 901 | 980 | 1,132 | 742 | 1,343 |
| 2024 | 1,393 | 295 | ||||||||||
| - = No Data Reported; -- = Not Applicable; NA = Not Available; W = Withheld to avoid disclosure of individual company data. |
| Release Date: 4/30/2024 |
| Next Release Date: 5/31/2024 |
Referring Pages: