|
Download Data (XLS File) |
|
||||||||
|
||||||||
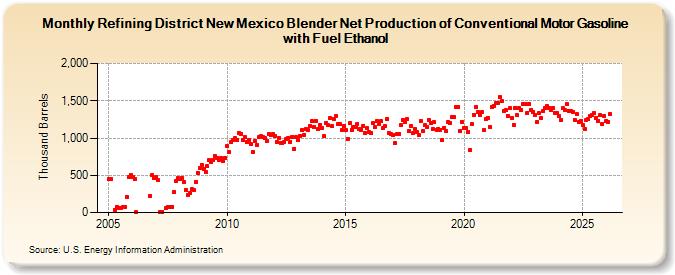
| Refining District New Mexico Blender Net Production of Conventional Motor Gasoline with Fuel Ethanol (Thousand Barrels) | ||||||||
| Year | Jan | Feb | Mar | Apr | May | Jun | Jul | Aug | Sep | Oct | Nov | Dec |
|---|---|---|---|---|---|---|---|---|---|---|---|---|
| 2005 | 447 | 445 | 38 | 79 | 66 | 67 | 71 | 70 | 212 | 474 | 500 | |
| 2006 | 482 | 447 | 1 | 224 | 505 | 457 | ||||||
| 2007 | 476 | 431 | 2 | 1 | 66 | 77 | 68 | 80 | 280 | 430 | 460 | |
| 2008 | 450 | 469 | 412 | 304 | 236 | 264 | 310 | 308 | 413 | 534 | 593 | 642 |
| 2009 | 590 | 548 | 621 | 705 | 684 | 699 | 753 | 734 | 711 | 726 | 688 | 727 |
| 2010 | 896 | 814 | 940 | 970 | 997 | 976 | 1,065 | 1,049 | 973 | 1,009 | 941 | 971 |
| 2011 | 920 | 814 | 962 | 913 | 1,010 | 1,023 | 1,017 | 1,000 | 962 | 1,053 | 1,036 | 1,050 |
| 2012 | 1,023 | 950 | 999 | 938 | 937 | 950 | 982 | 1,002 | 953 | 1,014 | 859 | 1,008 |
| 2013 | 971 | 1,028 | 1,109 | 1,040 | 1,120 | 1,106 | 1,167 | 1,224 | 1,152 | 1,234 | 1,120 | 1,173 |
| 2014 | 1,140 | 1,021 | 1,202 | 1,171 | 1,267 | 1,155 | 1,261 | 1,294 | 1,182 | 1,183 | 1,106 | 1,162 |
| 2015 | 1,104 | 989 | 1,195 | 1,111 | 1,154 | 1,147 | 1,190 | 1,127 | 1,114 | 1,165 | 1,063 | 1,128 |
| 2016 | 1,075 | 1,065 | 1,200 | 1,145 | 1,227 | 1,192 | 1,225 | 1,141 | 1,156 | 1,257 | 1,065 | 1,048 |
| 2017 | 1,039 | 936 | 1,051 | 1,056 | 1,175 | 1,239 | 1,211 | 1,252 | 1,095 | 1,166 | 1,067 | 1,119 |
| 2018 | 1,080 | 1,037 | 1,227 | 1,094 | 1,174 | 1,154 | 1,241 | 1,205 | 1,123 | 1,209 | 1,113 | 1,121 |
| 2019 | 1,114 | 969 | 1,141 | 1,089 | 1,220 | 1,204 | 1,276 | 1,280 | 1,417 | 1,414 | 1,091 | 1,221 |
| 2020 | 1,140 | 1,135 | 1,078 | 840 | 1,182 | 1,310 | 1,413 | 1,355 | 1,305 | 1,348 | 1,109 | 1,252 |
| 2021 | 1,273 | 1,149 | 1,422 | 1,436 | 1,465 | 1,474 | 1,552 | 1,496 | 1,358 | 1,372 | 1,296 | 1,398 |
| 2022 | 1,274 | 1,177 | 1,409 | 1,305 | 1,401 | 1,379 | 1,453 | 1,456 | 1,338 | 1,459 | 1,381 | 1,349 |
| 2023 | 1,353 | 1,243 | 1,339 | 1,292 | 1,363 | 1,399 | 1,424 | 1,409 | 1,375 | 1,408 | 1,340 | 1,336 |
| 2024 | 1,293 | |||||||||||
| - = No Data Reported; -- = Not Applicable; NA = Not Available; W = Withheld to avoid disclosure of individual company data. |
| Release Date: 3/29/2024 |
| Next Release Date: 4/30/2024 |