|
Download Data (XLS File) |
|
||||||||
|
||||||||
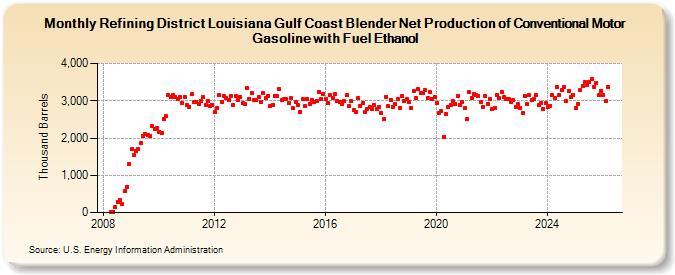
| Refining District Louisiana Gulf Coast Blender Net Production of Conventional Motor Gasoline with Fuel Ethanol (Thousand Barrels) | ||||||||
| Year | Jan | Feb | Mar | Apr | May | Jun | Jul | Aug | Sep | Oct | Nov | Dec |
|---|---|---|---|---|---|---|---|---|---|---|---|---|
| 2008 | 9 | 14 | 136 | 292 | 349 | 232 | 573 | 689 | 1,299 | |||
| 2009 | 1,696 | 1,545 | 1,665 | 1,706 | 1,860 | 2,063 | 2,100 | 2,080 | 2,053 | 2,319 | 2,233 | 2,266 |
| 2010 | 2,170 | 2,129 | 2,501 | 2,579 | 3,164 | 3,092 | 3,146 | 3,109 | 3,057 | 3,095 | 2,931 | 3,106 |
| 2011 | 2,873 | 2,840 | 3,177 | 2,957 | 2,978 | 2,926 | 2,999 | 3,097 | 2,891 | 2,991 | 2,855 | 2,891 |
| 2012 | 2,687 | 2,798 | 3,141 | 2,969 | 3,131 | 3,081 | 3,011 | 3,124 | 2,898 | 3,129 | 3,018 | 3,104 |
| 2013 | 2,930 | 2,913 | 3,331 | 3,050 | 3,207 | 3,031 | 3,011 | 3,102 | 2,971 | 3,204 | 3,082 | 3,135 |
| 2014 | 2,867 | 2,886 | 3,133 | 3,121 | 3,315 | 3,030 | 3,048 | 3,037 | 2,928 | 3,062 | 2,796 | 2,955 |
| 2015 | 2,873 | 2,711 | 3,055 | 2,851 | 3,043 | 2,914 | 3,009 | 2,971 | 2,985 | 3,246 | 3,036 | 3,177 |
| 2016 | 3,050 | 2,943 | 3,142 | 3,075 | 3,176 | 2,995 | 2,972 | 2,915 | 2,984 | 3,152 | 2,857 | 2,987 |
| 2017 | 2,748 | 2,705 | 3,061 | 2,863 | 2,942 | 2,689 | 2,786 | 2,835 | 2,775 | 2,884 | 2,773 | 2,830 |
| 2018 | 2,658 | 2,501 | 3,114 | 2,851 | 3,023 | 2,831 | 2,908 | 3,049 | 2,818 | 3,131 | 2,984 | 3,043 |
| 2019 | 2,964 | 2,818 | 3,262 | 3,087 | 3,305 | 3,221 | 3,202 | 3,286 | 3,062 | 3,224 | 3,036 | 3,092 |
| 2020 | 2,936 | 2,664 | 2,722 | 2,040 | 2,656 | 2,827 | 2,882 | 2,987 | 2,916 | 3,139 | 2,877 | 2,968 |
| 2021 | 2,810 | 2,517 | 3,233 | 3,075 | 3,178 | 3,154 | 3,132 | 2,976 | 2,841 | 3,115 | 2,916 | 3,037 |
| 2022 | 2,782 | 2,802 | 3,166 | 3,061 | 3,247 | 3,090 | 3,049 | 3,050 | 2,975 | 3,012 | 2,842 | 2,904 |
| 2023 | 2,807 | 2,679 | 3,136 | 2,917 | 3,147 | 3,011 | 3,044 | 3,144 | 2,878 | 2,952 | 2,778 | 2,931 |
| 2024 | 2,828 | 2,865 | ||||||||||
| - = No Data Reported; -- = Not Applicable; NA = Not Available; W = Withheld to avoid disclosure of individual company data. |
| Release Date: 4/30/2024 |
| Next Release Date: 5/31/2024 |