|
Download Data (XLS File) |
|
||||||||
|
||||||||
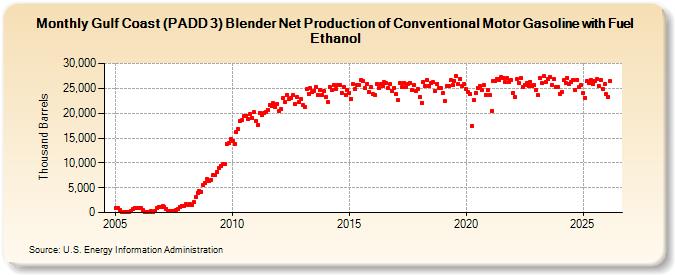
| Gulf Coast (PADD 3) Blender Net Production of Conventional Motor Gasoline with Fuel Ethanol (Thousand Barrels) | ||||||||
| Year | Jan | Feb | Mar | Apr | May | Jun | Jul | Aug | Sep | Oct | Nov | Dec |
|---|---|---|---|---|---|---|---|---|---|---|---|---|
| 2005 | 947 | 869 | 515 | 151 | 204 | 191 | 194 | 209 | 334 | 766 | 991 | 961 |
| 2006 | 999 | 868 | 487 | 101 | 116 | 91 | 347 | 114 | 298 | 852 | 1,159 | 1,169 |
| 2007 | 1,254 | 1,162 | 756 | 236 | 257 | 321 | 400 | 443 | 655 | 1,187 | 1,411 | 1,374 |
| 2008 | 1,633 | 1,531 | 1,764 | 1,438 | 2,087 | 3,075 | 3,986 | 4,373 | 4,190 | 5,516 | 5,961 | 6,725 |
| 2009 | 6,434 | 6,619 | 7,545 | 7,648 | 8,159 | 8,877 | 9,417 | 9,844 | 9,845 | 13,855 | 13,970 | 14,798 |
| 2010 | 14,301 | 13,824 | 16,149 | 16,768 | 18,381 | 18,584 | 19,424 | 19,503 | 18,813 | 19,818 | 19,073 | 20,160 |
| 2011 | 18,465 | 17,600 | 20,130 | 19,615 | 19,982 | 20,232 | 20,701 | 21,630 | 21,364 | 21,992 | 21,150 | 21,929 |
| 2012 | 20,496 | 20,741 | 23,075 | 22,308 | 23,667 | 22,903 | 22,984 | 23,610 | 21,828 | 23,340 | 22,182 | 22,814 |
| 2013 | 21,638 | 21,250 | 24,802 | 23,923 | 25,053 | 24,199 | 24,560 | 25,275 | 23,633 | 24,757 | 23,663 | 24,387 |
| 2014 | 23,289 | 22,170 | 25,311 | 24,644 | 25,767 | 24,807 | 25,699 | 25,644 | 24,066 | 25,356 | 23,741 | 24,698 |
| 2015 | 24,123 | 22,839 | 25,891 | 24,865 | 25,746 | 25,662 | 26,688 | 26,432 | 25,016 | 25,962 | 24,281 | 25,231 |
| 2016 | 23,921 | 23,633 | 25,905 | 25,017 | 25,864 | 25,389 | 26,220 | 26,005 | 25,000 | 25,851 | 24,545 | 25,133 |
| 2017 | 23,816 | 22,596 | 26,154 | 25,288 | 26,163 | 25,357 | 25,954 | 26,122 | 24,570 | 25,611 | 24,485 | 24,870 |
| 2018 | 23,215 | 22,126 | 26,350 | 25,505 | 26,687 | 25,542 | 25,978 | 26,295 | 24,424 | 25,926 | 25,092 | 24,998 |
| 2019 | 24,090 | 22,385 | 25,472 | 25,429 | 26,610 | 25,743 | 26,553 | 27,401 | 25,867 | 26,951 | 25,377 | 25,898 |
| 2020 | 24,842 | 24,194 | 23,795 | 17,451 | 22,618 | 24,139 | 25,118 | 25,529 | 24,615 | 25,595 | 23,744 | 24,650 |
| 2021 | 23,626 | 20,480 | 26,516 | 26,428 | 26,966 | 26,771 | 27,301 | 27,157 | 26,260 | 26,993 | 26,217 | 26,675 |
| 2022 | 24,086 | 23,269 | 26,820 | 26,158 | 27,097 | 25,320 | 25,746 | 26,103 | 25,449 | 26,335 | 25,372 | 25,631 |
| 2023 | 24,668 | 23,571 | 27,052 | 26,070 | 27,391 | 26,336 | 26,835 | 27,318 | 25,766 | 26,798 | 25,192 | 25,279 |
| 2024 | 23,922 | 24,215 | 26,613 | 25,997 | 27,141 | 25,798 | ||||||
| - = No Data Reported; -- = Not Applicable; NA = Not Available; W = Withheld to avoid disclosure of individual company data. |
| Release Date: 8/30/2024 |
| Next Release Date: 9/30/2024 |