|
Download Data (XLS File) |
|
||||||||
|
||||||||
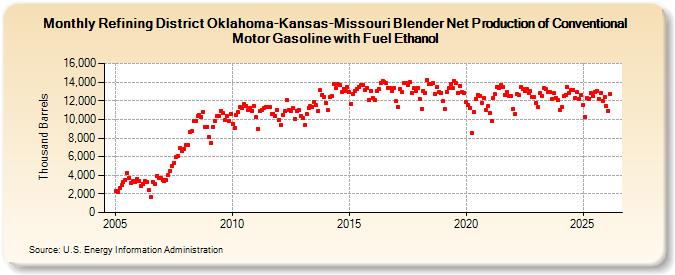
| Refining District Oklahoma-Kansas-Missouri Blender Net Production of Conventional Motor Gasoline with Fuel Ethanol (Thousand Barrels) | ||||||||
| Year | Jan | Feb | Mar | Apr | May | Jun | Jul | Aug | Sep | Oct | Nov | Dec |
|---|---|---|---|---|---|---|---|---|---|---|---|---|
| 2005 | 2,333 | 2,225 | 2,583 | 2,929 | 3,261 | 3,547 | 4,292 | 3,742 | 3,128 | 3,413 | 3,325 | 3,602 |
| 2006 | 3,433 | 2,890 | 3,087 | 3,339 | 3,296 | 2,430 | 1,654 | 3,330 | 3,035 | 3,913 | 3,706 | 3,723 |
| 2007 | 3,458 | 3,428 | 3,547 | 4,053 | 4,453 | 5,046 | 5,362 | 5,924 | 6,066 | 6,928 | 6,652 | 6,820 |
| 2008 | 7,273 | 7,303 | 8,595 | 8,741 | 9,789 | 9,870 | 10,334 | 10,445 | 10,241 | 10,824 | 9,155 | 9,203 |
| 2009 | 8,074 | 7,492 | 9,232 | 9,790 | 10,385 | 10,343 | 10,938 | 10,645 | 9,927 | 10,412 | 9,821 | 10,600 |
| 2010 | 9,549 | 9,113 | 10,479 | 10,742 | 11,290 | 11,173 | 11,647 | 11,490 | 10,968 | 11,230 | 10,918 | 11,481 |
| 2011 | 10,225 | 9,009 | 10,859 | 10,978 | 11,201 | 11,340 | 11,345 | 11,295 | 10,569 | 10,628 | 10,343 | 11,009 |
| 2012 | 9,964 | 9,366 | 10,501 | 10,850 | 12,080 | 11,051 | 10,938 | 11,181 | 10,068 | 10,887 | 11,034 | 10,330 |
| 2013 | 10,127 | 9,360 | 10,612 | 11,240 | 11,387 | 11,292 | 11,876 | 11,505 | 10,910 | 13,102 | 12,611 | 12,416 |
| 2014 | 11,810 | 10,966 | 12,354 | 12,536 | 13,752 | 13,334 | 13,783 | 13,705 | 12,900 | 13,240 | 12,994 | 13,496 |
| 2015 | 12,917 | 11,683 | 12,778 | 13,087 | 13,272 | 13,425 | 13,712 | 13,673 | 13,131 | 13,398 | 12,124 | 13,063 |
| 2016 | 12,347 | 12,040 | 12,993 | 13,245 | 13,946 | 14,105 | 14,007 | 13,880 | 13,402 | 13,365 | 13,097 | 13,394 |
| 2017 | 11,941 | 11,353 | 13,250 | 12,914 | 13,880 | 13,868 | 13,667 | 14,027 | 12,821 | 13,383 | 13,016 | 13,403 |
| 2018 | 12,239 | 11,168 | 13,066 | 12,838 | 14,248 | 13,779 | 13,823 | 13,914 | 12,768 | 13,427 | 12,990 | 12,849 |
| 2019 | 11,931 | 11,074 | 12,983 | 13,342 | 13,790 | 13,361 | 14,093 | 13,852 | 12,864 | 13,583 | 12,897 | 12,821 |
| 2020 | 11,834 | 11,575 | 11,218 | 8,545 | 10,838 | 12,234 | 12,633 | 12,521 | 11,766 | 12,297 | 11,045 | 11,410 |
| 2021 | 10,650 | 9,787 | 12,316 | 12,676 | 13,494 | 13,413 | 13,639 | 13,527 | 12,657 | 12,958 | 12,520 | 12,558 |
| 2022 | 11,144 | 10,564 | 12,718 | 12,581 | 13,511 | 13,240 | 13,035 | 13,266 | 12,781 | 13,003 | 12,420 | 12,387 |
| 2023 | 11,747 | 11,285 | 12,822 | 12,553 | 13,352 | 13,245 | 12,952 | 12,936 | 12,142 | 12,786 | 12,320 | 12,073 |
| 2024 | 11,040 | |||||||||||
| - = No Data Reported; -- = Not Applicable; NA = Not Available; W = Withheld to avoid disclosure of individual company data. |
| Release Date: 3/29/2024 |
| Next Release Date: 4/30/2024 |