|
Download Data (XLS File) |
|
||||||||
|
||||||||
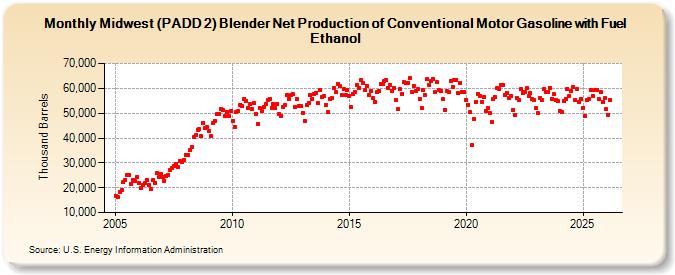
| Midwest (PADD 2) Blender Net Production of Conventional Motor Gasoline with Fuel Ethanol (Thousand Barrels) | ||||||||
| Year | Jan | Feb | Mar | Apr | May | Jun | Jul | Aug | Sep | Oct | Nov | Dec |
|---|---|---|---|---|---|---|---|---|---|---|---|---|
| 2005 | 16,850 | 16,120 | 18,141 | 19,034 | 22,120 | 23,169 | 24,959 | 25,166 | 21,598 | 23,118 | 22,674 | 24,370 |
| 2006 | 21,860 | 19,733 | 21,132 | 21,834 | 23,232 | 21,133 | 19,310 | 22,959 | 22,093 | 25,736 | 24,129 | 25,519 |
| 2007 | 24,299 | 22,817 | 24,709 | 25,214 | 27,120 | 27,933 | 28,697 | 29,451 | 28,152 | 30,754 | 30,245 | 31,301 |
| 2008 | 33,326 | 33,176 | 35,045 | 36,246 | 40,369 | 41,024 | 43,306 | 43,610 | 40,683 | 46,119 | 43,920 | 44,303 |
| 2009 | 42,746 | 40,718 | 46,041 | 46,822 | 49,617 | 49,784 | 51,746 | 51,137 | 48,768 | 50,503 | 48,852 | 51,024 |
| 2010 | 47,032 | 44,617 | 50,314 | 50,711 | 53,437 | 52,817 | 55,803 | 54,986 | 51,927 | 53,560 | 51,573 | 54,039 |
| 2011 | 49,732 | 45,825 | 51,928 | 50,753 | 52,571 | 53,620 | 55,285 | 55,851 | 52,135 | 53,841 | 52,080 | 53,664 |
| 2012 | 49,673 | 48,996 | 52,509 | 53,205 | 57,215 | 55,861 | 57,179 | 57,590 | 52,665 | 55,893 | 52,965 | 52,858 |
| 2013 | 50,217 | 46,899 | 53,356 | 53,906 | 57,143 | 55,870 | 57,786 | 58,279 | 53,937 | 59,361 | 56,458 | 56,971 |
| 2014 | 53,290 | 50,324 | 55,728 | 56,034 | 60,266 | 58,497 | 61,774 | 60,994 | 57,230 | 59,676 | 57,263 | 59,487 |
| 2015 | 57,104 | 52,360 | 57,638 | 58,549 | 61,244 | 60,229 | 63,250 | 62,126 | 59,152 | 61,116 | 57,288 | 58,921 |
| 2016 | 55,976 | 54,621 | 58,578 | 58,995 | 61,720 | 61,935 | 63,003 | 63,323 | 60,147 | 61,440 | 58,959 | 60,088 |
| 2017 | 55,281 | 51,523 | 59,628 | 57,733 | 62,411 | 62,234 | 62,300 | 64,030 | 58,497 | 60,744 | 58,860 | 59,610 |
| 2018 | 55,808 | 52,168 | 59,245 | 57,186 | 63,567 | 61,480 | 62,854 | 63,605 | 58,463 | 62,474 | 59,286 | 59,107 |
| 2019 | 55,557 | 51,243 | 58,776 | 58,590 | 62,980 | 60,542 | 63,449 | 63,483 | 57,989 | 62,146 | 58,589 | 58,376 |
| 2020 | 55,276 | 53,298 | 50,316 | 37,387 | 47,572 | 54,533 | 57,917 | 56,984 | 54,581 | 56,499 | 50,811 | 52,177 |
| 2021 | 50,202 | 46,420 | 55,830 | 56,508 | 59,993 | 59,648 | 61,521 | 61,330 | 57,506 | 58,314 | 56,283 | 56,996 |
| 2022 | 51,352 | 49,288 | 56,288 | 55,418 | 59,632 | 58,225 | 58,628 | 60,002 | 56,846 | 58,138 | 55,605 | 55,298 |
| 2023 | 51,934 | 49,934 | 56,092 | 55,348 | 59,845 | 58,472 | 58,595 | 60,287 | 55,757 | 57,728 | 55,316 | 54,777 |
| 2024 | 50,784 | |||||||||||
| - = No Data Reported; -- = Not Applicable; NA = Not Available; W = Withheld to avoid disclosure of individual company data. |
| Release Date: 3/29/2024 |
| Next Release Date: 4/30/2024 |