|
Download Data (XLS File) |
|
||||||||
|
||||||||
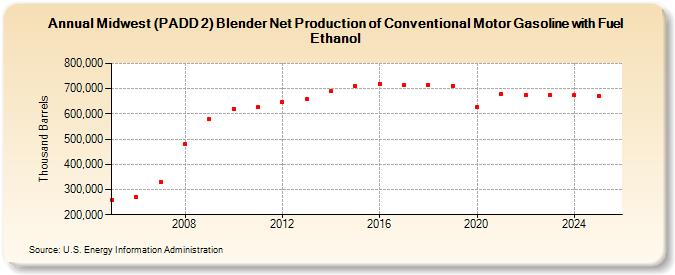
| Midwest (PADD 2) Blender Net Production of Conventional Motor Gasoline with Fuel Ethanol (Thousand Barrels) | ||||||||
| Decade | Year-0 | Year-1 | Year-2 | Year-3 | Year-4 | Year-5 | Year-6 | Year-7 | Year-8 | Year-9 |
|---|---|---|---|---|---|---|---|---|---|---|
| 2000's | 257,319 | 268,670 | 330,692 | 481,127 | 577,758 | |||||
| 2010's | 620,816 | 627,285 | 646,609 | 660,183 | 690,563 | 708,977 | 718,785 | 712,851 | 715,243 | 711,720 |
| 2020's | 627,351 | 680,551 | 674,720 | 674,085 |
| - = No Data Reported; -- = Not Applicable; NA = Not Available; W = Withheld to avoid disclosure of individual company data. |
| Release Date: 3/29/2024 |
| Next Release Date: 8/30/2024 |