|
Download Data (XLS File) |
|
||||||||
|
||||||||
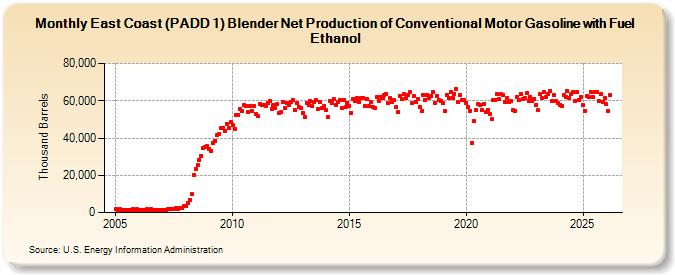
| East Coast (PADD 1) Blender Net Production of Conventional Motor Gasoline with Fuel Ethanol (Thousand Barrels) | ||||||||
| Year | Jan | Feb | Mar | Apr | May | Jun | Jul | Aug | Sep | Oct | Nov | Dec |
|---|---|---|---|---|---|---|---|---|---|---|---|---|
| 2005 | 1,705 | 1,605 | 1,853 | 1,126 | 1,201 | 1,269 | 1,363 | 1,410 | 1,156 | 1,702 | 1,619 | 1,705 |
| 2006 | 1,372 | 1,379 | 1,530 | 1,598 | 1,784 | 1,637 | 1,680 | 1,563 | 1,348 | 1,443 | 1,405 | 1,439 |
| 2007 | 1,280 | 1,287 | 1,371 | 1,830 | 2,123 | 2,070 | 2,135 | 2,222 | 2,028 | 2,283 | 2,573 | 3,305 |
| 2008 | 3,748 | 5,150 | 6,913 | 10,063 | 20,389 | 23,458 | 25,494 | 28,431 | 30,379 | 34,567 | 35,320 | 35,531 |
| 2009 | 33,949 | 33,156 | 37,476 | 38,589 | 41,412 | 42,244 | 45,402 | 45,579 | 43,707 | 47,639 | 45,175 | 48,529 |
| 2010 | 46,750 | 44,941 | 52,328 | 52,373 | 55,595 | 54,456 | 57,813 | 57,345 | 54,081 | 57,410 | 54,570 | 57,078 |
| 2011 | 52,663 | 51,667 | 58,389 | 57,509 | 57,758 | 57,305 | 58,969 | 59,999 | 55,646 | 57,907 | 55,974 | 58,049 |
| 2012 | 53,644 | 53,772 | 59,458 | 56,238 | 59,033 | 57,943 | 59,472 | 60,540 | 54,845 | 58,780 | 56,693 | 56,157 |
| 2013 | 53,509 | 51,297 | 59,003 | 57,622 | 59,766 | 57,093 | 59,172 | 60,265 | 55,501 | 59,346 | 56,024 | 57,348 |
| 2014 | 54,999 | 51,401 | 59,953 | 58,676 | 60,708 | 57,501 | 59,305 | 60,288 | 56,037 | 60,324 | 56,414 | 59,016 |
| 2015 | 56,995 | 53,533 | 60,875 | 59,636 | 61,334 | 59,408 | 61,353 | 61,600 | 57,447 | 61,128 | 56,953 | 59,289 |
| 2016 | 56,584 | 55,899 | 61,957 | 60,029 | 62,158 | 61,296 | 62,879 | 63,713 | 58,606 | 61,554 | 59,205 | 60,474 |
| 2017 | 56,430 | 53,941 | 62,775 | 60,680 | 63,492 | 61,435 | 63,059 | 64,463 | 58,562 | 62,402 | 59,420 | 60,733 |
| 2018 | 56,776 | 54,313 | 63,103 | 60,612 | 63,200 | 61,551 | 62,394 | 64,431 | 58,956 | 62,778 | 60,153 | 59,897 |
| 2019 | 58,593 | 54,407 | 63,268 | 61,519 | 64,571 | 61,485 | 63,758 | 66,290 | 59,113 | 63,183 | 60,208 | 60,630 |
| 2020 | 59,042 | 56,651 | 54,685 | 37,228 | 49,004 | 54,899 | 58,085 | 57,972 | 55,123 | 58,140 | 53,824 | 55,147 |
| 2021 | 53,115 | 50,009 | 60,178 | 60,551 | 63,433 | 61,185 | 63,399 | 63,065 | 59,284 | 61,539 | 59,064 | 60,033 |
| 2022 | 54,847 | 54,627 | 62,243 | 60,240 | 63,670 | 60,814 | 61,587 | 63,906 | 60,089 | 62,116 | 59,783 | 61,002 |
| 2023 | 57,683 | 54,914 | 63,150 | 60,968 | 64,452 | 61,687 | 63,651 | 65,078 | 59,855 | 62,817 | 60,010 | 58,997 |
| 2024 | 57,831 | |||||||||||
| - = No Data Reported; -- = Not Applicable; NA = Not Available; W = Withheld to avoid disclosure of individual company data. |
| Release Date: 3/29/2024 |
| Next Release Date: 4/30/2024 |